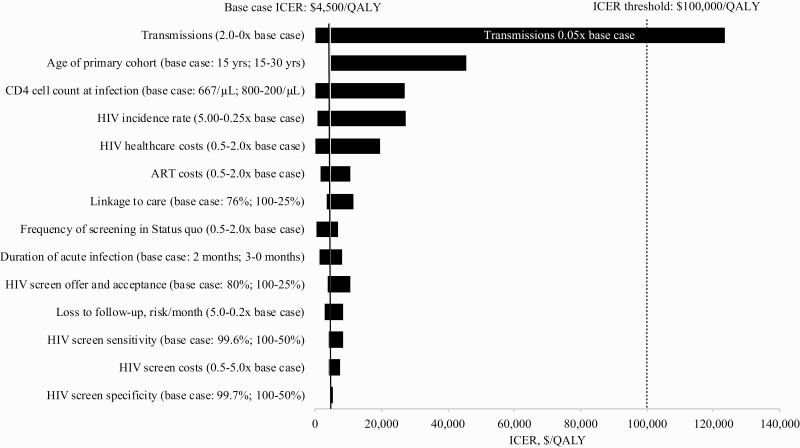
Figure 4.
Sensitivity analyses: Incremental cost-effectiveness ratio of 3-monthly compared to the next least costly strategy, Expanded cohort. On the vertical axis, parameters and the ranges over which they are varied are shown. Incremental cost-effectiveness ratios (ICERs) for the comparison of 3-monthly vs 6-monthly are shown on the horizontal axis, in $/quality-adjusted life year (QALY). The range of ICERs for each varied parameter is indicated by the horizontal bars. Longer horizontal bars indicate parameters to which the model results are more sensitive. The black vertical line indicates the ICER for 3-monthly compared to 6-monthly in the base case ($4500/QALY). The vertical line indicates the cost-effectiveness threshold for this analysis, $100 000/QALY, and the white text within the bar indicates parameter values at which the threshold is crossed. 3-monthly compared to 6-monthly exceeds $100 000/QALY only if transmission rates are set to ≤0.05 times their base case values. Abbreviation: ART, antiretroviral therapy.

