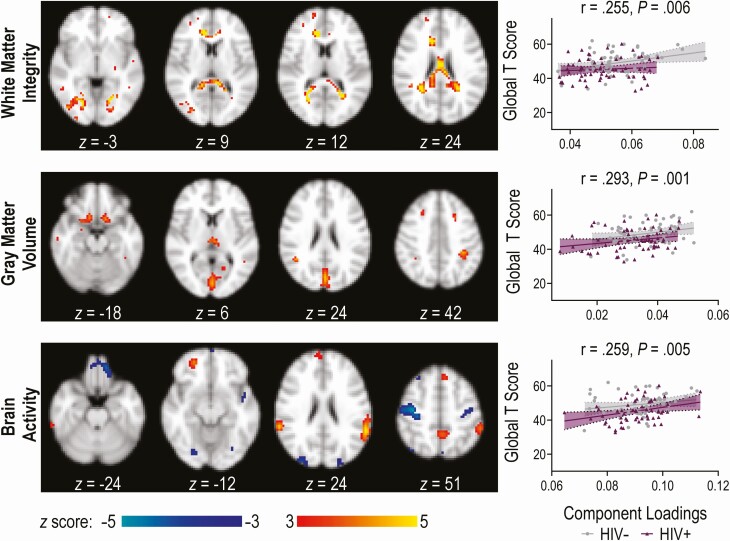
Figure 2.
Illustration of the joint independent component for each magnetic resonance imaging modality. The brain maps show the regions that comprise the multimodal component with brain maps visualized at |z| > 3.0. The regional homogeneity map includes regions with positive activation (lighter shading) and negative activation, or deactivation (darker shading). The scatter plots to the right illustrate the correlation of the component loadings with cognitive performance (global T score). Abbreviation: HIV, human immunodeficiency virus.

