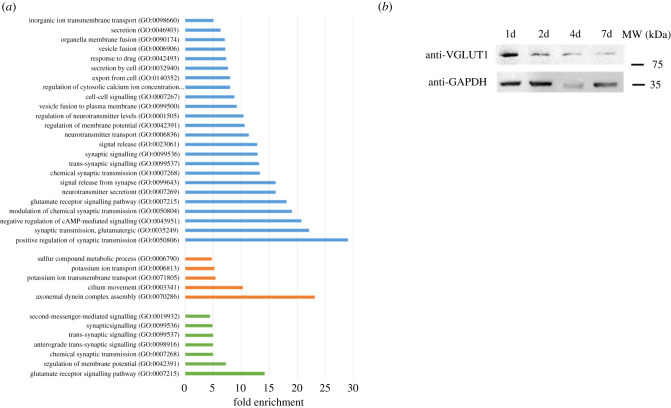
Figure 5.
Gene ontology analysis of enriched downregulated pathways in brain cells. (a) Enriched GO pathways for downregulated DEGs that are shared for all time point infected brain cells (blue bars), shared for 1d and 2d time points (orange bars) and shared for 7d and 14d time points (green bars). Pathways were selected with an FDR of 0.05 and a minimum enrichment of 4. The name of each GO pathway is indicated on the left part of the figure. Bars represent the enrichment fold. (b) Western blot showing the expression of Grm1 (VGLUT1) in neurons after 1, 2, 4 and 7 days of infection. GAPDH is used as a loading control.

