
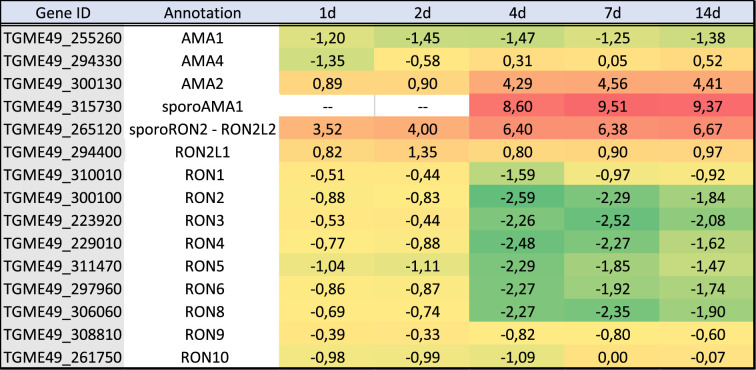
Table 5.
Gene expression for transcripts encoding proteins known to be involved in invasion. Log2 FC comparing the expression T. gondii transcripts at each time point of the infected brain cell culture to that of purified tachyzoites. Colour gradient depends on the value of FC. Downregulated values are represented in shades of green. Upregulated values are represented in shades of red. Transcripts that were not detected are indicated by a double dash line (–). For each transcript, the gene identification number (gene ID) and the corresponding annotation are also presented.
 |