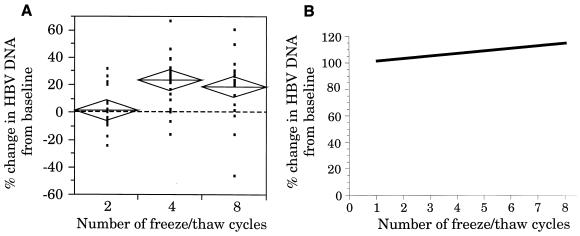
FIG. 1.
(A) Scattergram showing the percent change in HBV DNA levels in serum specimens exposed to two, four, and eight FT cycles compared to the baseline level. The change in HBV DNA concentration for each specimen is depicted as a data point, with the percent change from the baseline plotted on the y axis and the number of FT cycles on the x axis. The height of the diamonds overlaying the data points represents the 95% confidence interval; the diamond width represents the group sample size; and the line across each diamond represents the mean. The dotted horizontal line at 0% represents no change in HBV DNA levels and was derived from the baseline mean for each sample. (B) Linear regression analysis of the changes in HBV DNA levels in serum specimens subjected to up to eight FT cycles.

