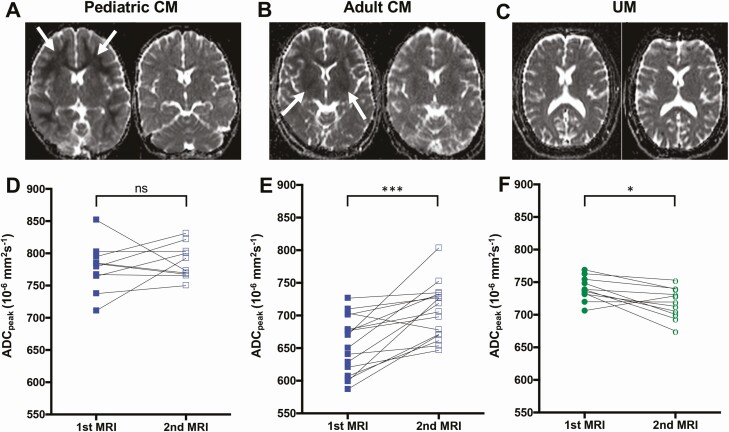
Figure 2.
Evolution of apparent diffusion coefficient (ADC) between admission and follow-up magnetic resonance imaging (MRI). A, C, and E, Representative sequential ADC maps at the same window level (130) and width (290) from 3 cases of pediatric cerebral malaria (CM), adult CM, and uncomplicated malaria (UM). A, Pediatric CM patient showing decreased ADC values in the white matter on admission (left, arrows) that resolved at follow-up (right). C, Adult CM patient showing decreased ADC values in the basal ganglia on admission (left) that reversed at follow-up (right). E, UM patient without pathological ADC changes on admission (left) or at follow-up (right). Whole-brain ADCpeak values on admission and at follow-up are displayed and grouped according to age and disease categories: nonfatal pediatric CM (B), nonfatal adult CM (D), and UM (F). *P < .05; ***P < .0005; ns, not significant.

