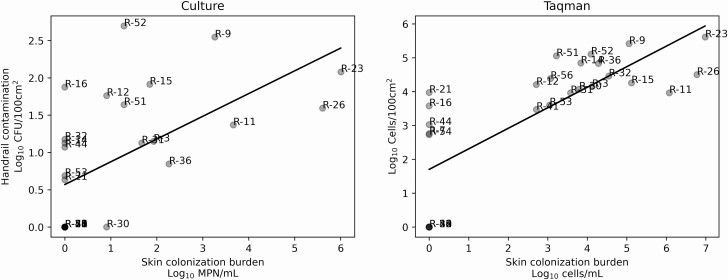
Figure 2.
Environmental contamination of the bed handrails (Y-axis) shown in relationship to the occupying resident’s skin colonization burden (X-axis) with culture-based (panel A) and qPCR-based (panel B) methods. Gray points indicate the average of both the left and right handrails associated with a given resident. Linear regression shown for visual aid. Relationship between environmental contamination on handrails and resident colonization burden assessed with non-parametric Kendall’s tau-B.

