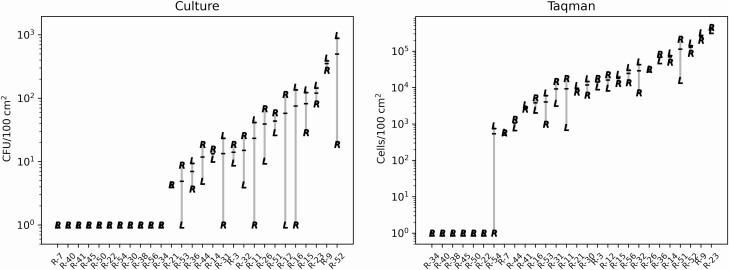
Figure 3.
Concentrations of C. auris on the left and right handrails of each resident’s bed. Culture results are shown in the left panel and qPCR results are shown the right panel. Left and Right sides of the bed indicated with an “L” and “R”, respectively. Samples are organized along the Y-axis based on ascending mean of left and right sides shown with black horizontal bar.

