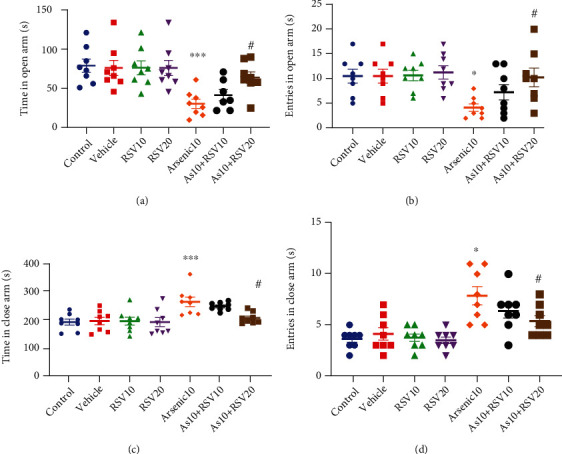
Figure 4.

Elevated plus maze. There was a significant difference in time in open arm As and control groups; moreover, there also showed a significant difference in the As group compared to the As+RSV20 group. The data are presented as mean ± SEM. ∗∗∗p < 0.001 vs. Control. #p < 0.05 vs. As+RSV20 (a). There was a significant difference between the As and control groups in entries into the open arm; moreover, there was a significant difference between the As and As+RSV20 groups in this parameter. The data are presented as mean ± SEM. ∗p < 0.05 vs. control. #p < 0.05 vs. As+RSV20 (b). There was a significant difference between the As and control groups in time spent in close arm; moreover, there was a significant difference between the As and As+RSV20 groups in this parameter. The data are presented as mean ± SEM. ∗∗∗p < 0.001 vs. control. #p < 0.05 vs. As+RSV20 (c). There was a significant difference in entries into close arm between As and control groups; moreover, there was a significant difference between As and As+RSV20 groups in this parameter. The data are presented as mean ± SEM. ∗p < 0.05 vs. control. #p < 0.05 vs. As+RSV20 (d).
