Figure 3.

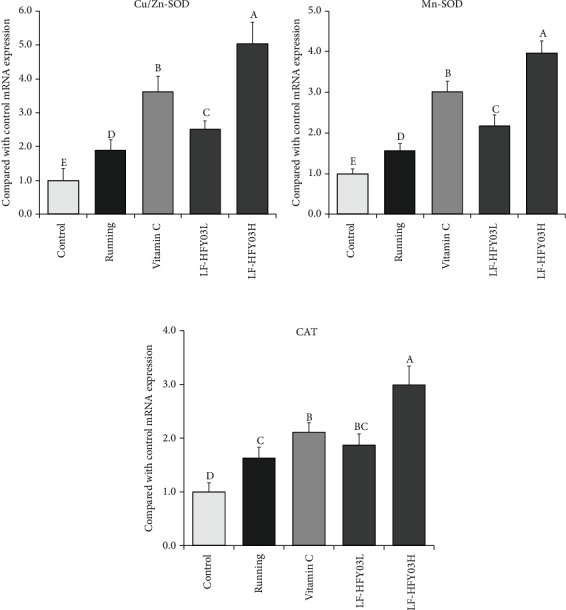
CAT, Cu/Zn-SOD, and Mn-SOD mRNA expression in mouse liver tissue. After passing the examination and analysis of (a–e), it was found that there were significant differences between the two groups with different superscripts (P < 0.05).

CAT, Cu/Zn-SOD, and Mn-SOD mRNA expression in mouse liver tissue. After passing the examination and analysis of (a–e), it was found that there were significant differences between the two groups with different superscripts (P < 0.05).