Figure 4.

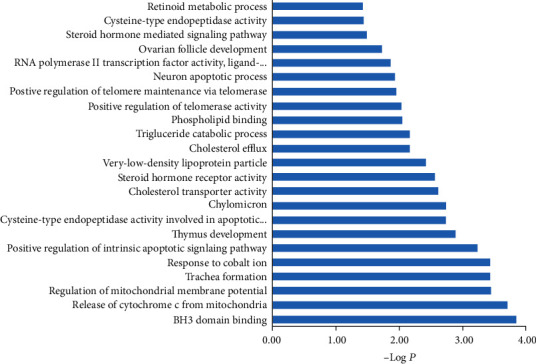
GO enrichment analysis of targets. The y-axis represents the biological process of the top 23 functional enrichment, and the x-axis represents the negative logarithm of P value.

GO enrichment analysis of targets. The y-axis represents the biological process of the top 23 functional enrichment, and the x-axis represents the negative logarithm of P value.