Figure 5.

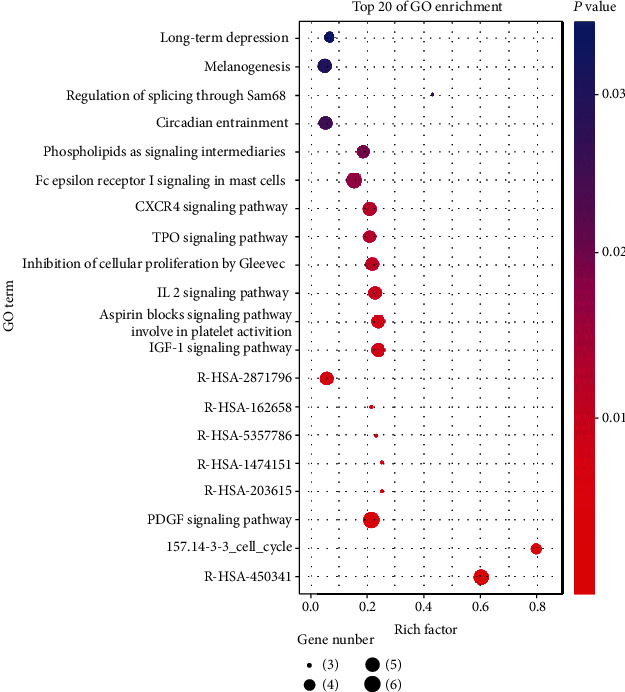
Top 20 of pathway enrichment. The circle size stands for gene numbers, the red color and higher rich factor indicate greater enrichment of pathways.

Top 20 of pathway enrichment. The circle size stands for gene numbers, the red color and higher rich factor indicate greater enrichment of pathways.