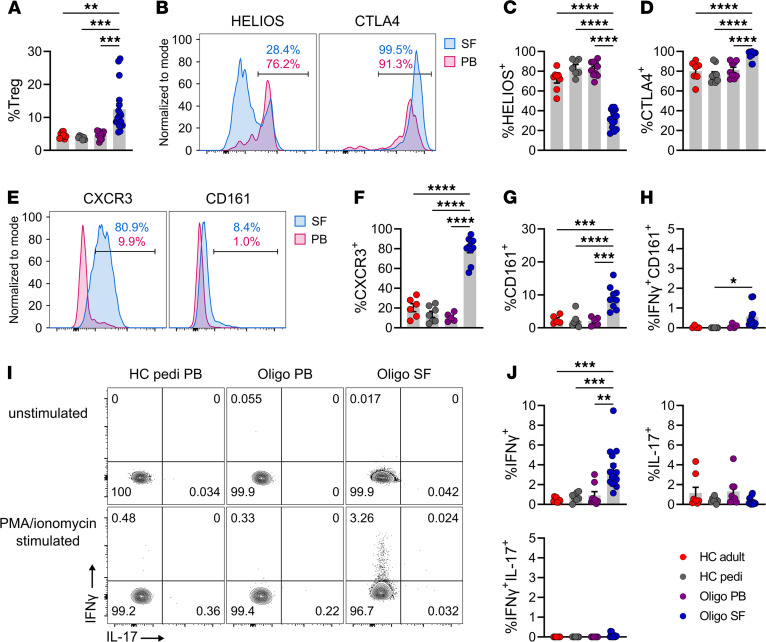
Figure 2. The SF in oligo JIA patients is enriched in Tregs expressing Th1 markers.
(A) Percentage CD25+CD127loFOPX3+ (Tregs) cells among CD4+ lymphocytes in the PB of adult (n = 8) and pediatric (n = 7) controls and in the PB (n = 10) or SF (n = 17) of oligo JIA patients. (B) Representative histogram of HELIOS (unstimulated cells) and CTLA4 (stimulated cells) MFI in paired PB and SF samples from an oligo JIA patient, gated on Tregs. (C) Percentage Tregs expressing HELIOS in HC adult PB (n = 8), HC pediatric PB (n = 7), oligo JIA PB (n = 10), and SF (n = 15). (D) Percentage Tregs expressing CTLA4 after stimulation in HC adult PB (n = 7), HC pediatric PB (n = 9), oligo JIA PB (n = 9), and SF (n = 16). (E) Representative histogram of CXCR3 and CD161 MFI in unstimulated Tregs. (F) Percentage Tregs expressing CXCR3 in HC adult PB (n = 6), HC pediatric PB (n = 7), oligo JIA PB (n = 5), and SF (n = 10). (G) Percentage Tregs expressing CD161 in HC adult PB (n = 5), HC pediatric PB (n = 7), oligo JIA PB (n = 5), and SF (n = 9). (H) Percentage Tregs jointly expressing IFN-γ and CD161 after stimulation in HC adult PB (n = 4), HC pediatric PB (n = 7), oligo JIA PB (n = 4), and SF (n = 10). (I) Representative flow staining of cytokine production in unstimulated and stimulated Tregs. (J) Percentage of Tregs expressing IFN-γ, IL-17, or both cytokines after stimulation in HC adult PB (n = 8), HC pediatric PB (n = 7), oligo JIA PB (n = 8), and SF (n = 16). Summary data on bar graphs are mean ± SEM. *P < 0.05, **P < 0.01, ***P < 0.001, ****P < 0.0001. Statistical testing: 1-way ANOVA followed by multiple 2-tailed t tests with Tukey’s correction. HC, healthy control; pedi, pediatric; oligo, oligoarticular juvenile idiopathic arthritis; PB, peripheral blood; SF, synovial fluid.

