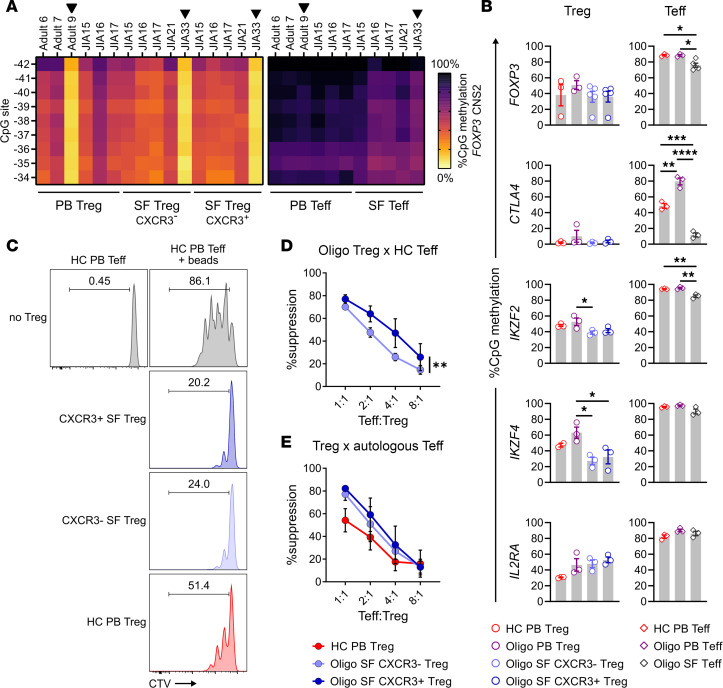
Figure 4. Th1-like Tregs maintain Treg-specific demethylation patterns and suppressive function.
(A) Heatmap of methylation at 9 CpG sites in the conserved noncoding sequence 2 (CNS2) region of the FOXP3 locus in sorted Tregs (CD4+CD25+CD127lo) and Teffs (CD4+CD25–) from HC adult PB (n = 3) and oligo JIA PB (n = 3) and SF (n = 5). Black arrows highlight male subjects. (B) Percentage methylation (mean ± SEM) at CpG sites across different Treg-related gene loci in sorted Treg and Teff populations. The location of CpG sites for each locus is specified in Supplemental Table 3. IKZF2 encodes for HELIOS and IKZF4 encodes for EOS. (C) Representative histogram of CTV-positive Teffs (CD4+CD25–) after 4 days of coculture alone or with anti-CD2/CD3/CD28 beads and the corresponding Treg (CD4+CD25+CD127lo) population at a ratio of 1:1, gated on dividing Teffs. (D) Percentage suppression (mean ± SEM) in the proliferation of Teffs from a third-party control after cocultures with CXCR3+ SF Tregs or CXCR3– SF Tregs (n = 4 controls, n = 7 oligo JIA patients). See Supplemental Figure 4 for detailed representation per patient. (E) Percentage suppression (mean ± SEM) in the proliferation of Teffs from HC PB or oligo SF after cocultures with autologous Tregs (n = 4 controls, n = 4 oligo JIA patients). *P < 0.05, **P < 0.01, ***P < 0.001, ****P < 0.0001. Statistical testing: (B) 1-way ANOVA followed by multiple 2-tailed t tests with Tukey’s correction; (D and E) 2-way ANOVA assessing effect of Treg population and Teff/Treg ratio. HC, healthy control; oligo, oligoarticular juvenile idiopathic arthritis; PB, peripheral blood; SF, synovial fluid; CTV, CellTrace Violet.

