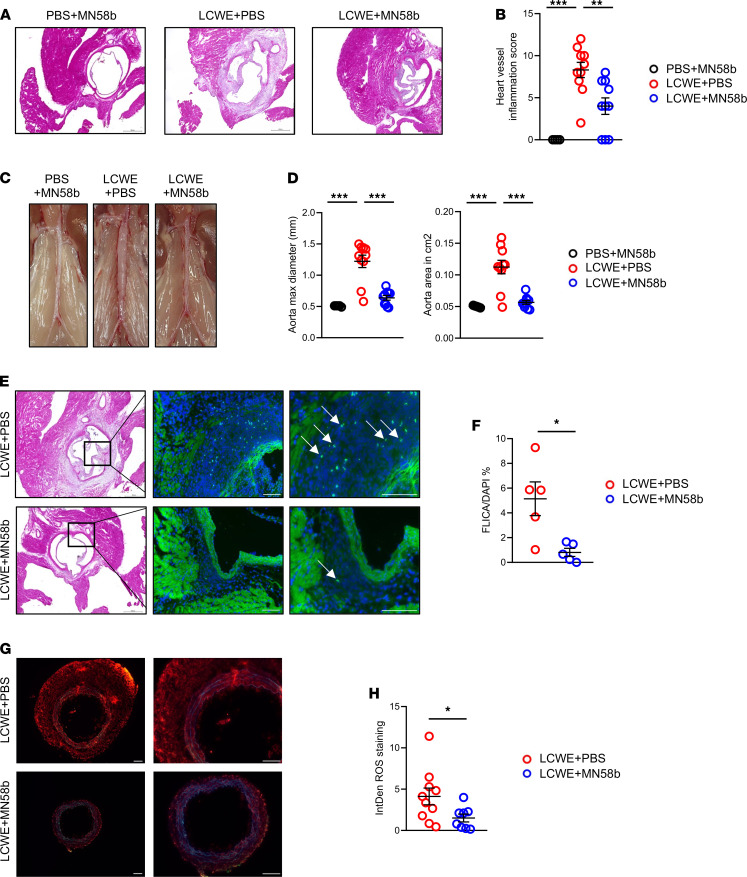
Figure 6. Modulation of AMPKα and ROS reduces cardiovascular lesions during LCWE-induced KD vasculitis.
(A and B) Heart sections H&E staining (A) and heart vessel inflammation score (B) of WT mice injected with either PBS and treated with MN58b (n = 5), injected with LCWE and treated with PBS (n = 10), or injected with LCWE and treated with MN58b (n = 10) at 1 week after LCWE injection. Scale bars: 500 µM. (C and D) Representative pictures of the abdominal aorta (C), maximal aorta diameter, and abdominal aorta area measurements (D) from the mouse groups in A and B. (E and F) Representative pictures of FLICA staining (E) and quantification (F) in heart tissue sections of LCWE-injected WT mice and LCWE-injected WT mice treated with MN58b, 1 week after LCWE injection (n = 5/group). White arrows indicate FLICA+ cells. Scale bars: 100 µm. (G and H) Representative DHE staining (G) and ROS quantification (H) in abdominal aorta tissue cross-sections LCWE-injected WT mice and LCWE-injected WT mice treated with MN58b 1 week after LCWE injection (n = 8–10/group). Scale bars: 100 µM. *P < 0.05, **P < 0.01, ***P < 0.001 by 1-way ANOVA with Tukey’s post hoc test analysis (B and D) and unpaired Student t tests for all other panels.

