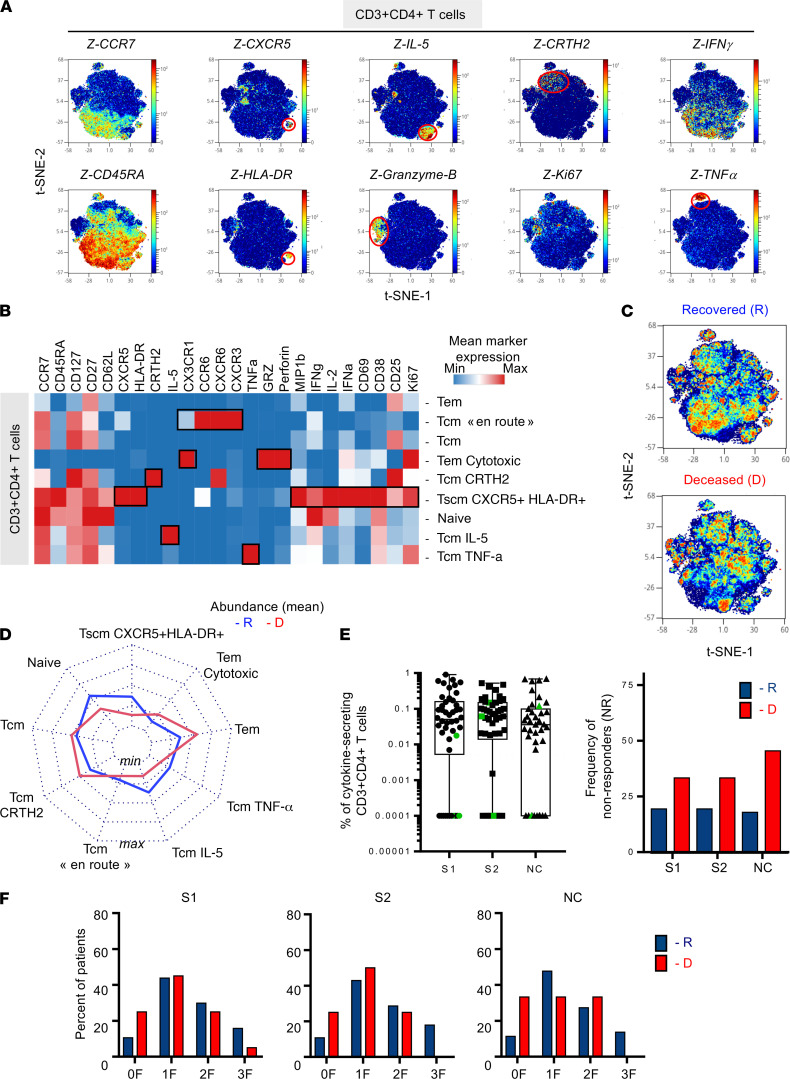
Figure 2. Increased frequencies of circulating polyfunctional CXCR5+HLA-DR+CD4+ T cells and Tem subsets are associated with survival in patients critically infected with COVID-19.
PBMCs from 21 patients critically ill with COVID-19 were incubated with brefeldin A (16 hours) and stained using multiparametric mass cytometry panel 2 (n = 21, R = 12, D = 9). (A) CD3+CD4+ T cells (20,000 subsampling events) were randomly taken for unsupervised cluster using FlowSOM. Density plot t-SNE represents the expression of indicated markers. (B) Heatmap representation of mean signal intensity of each marker in CD3+CD4+T cells. (C) Density plot t-SNE representing abundance of events using concatenated files of 12 R and 9 D patients. (D) Radar representing mean (min/max normalized) abundances of CD3+CD4+ T cell subsets in 12 R (blue) and 9 D (red) patients. Multiple Mann-Whitney U test using Benjamini, Krieger, and Yekutieli FDR correction was performed, with significance set at q < 0.05. (E) SARS-CoV-2–specific T cell responses were measured in PBMCs from 46 ICU patients on day 15 ± 0.85 (mean ± SEM) after symptoms onset. PBMCs were stimulated for 16 hours with SARS-CoV-2 overlapping peptides: S1, S2, and NC. The frequency of specific CD4+T cells (Boolean gating of IFN-γ, IL-2, and TNF-α) is represented with box-and-whisker plots (min to max) after background subtraction according to background control (left). Color-coded (green) symbols represent individuals that were under immunosuppressive treatment when SARS-CoV-2–specific responses were studied. The frequency of nonresponders (with <0.005% cytokine-secreting CD3+CD4+ T cells) is represented among R (blue; S1 and S2 n = 31; NC n = 28) and D (red; S1 and S2 n = 15; NC n = 11) patients (right). (F) Frequency of patients with cells producing cytokines (0, 1, 2, 3 F) after stimulation in R (blue) and D patients (red). χ2 test did not show significance. R, recovered; D, deceased; F, function; Tem, effector memory T cell; tSNE, t-distributed stochastic neighbor embedding; NC, nucleocapsid.

