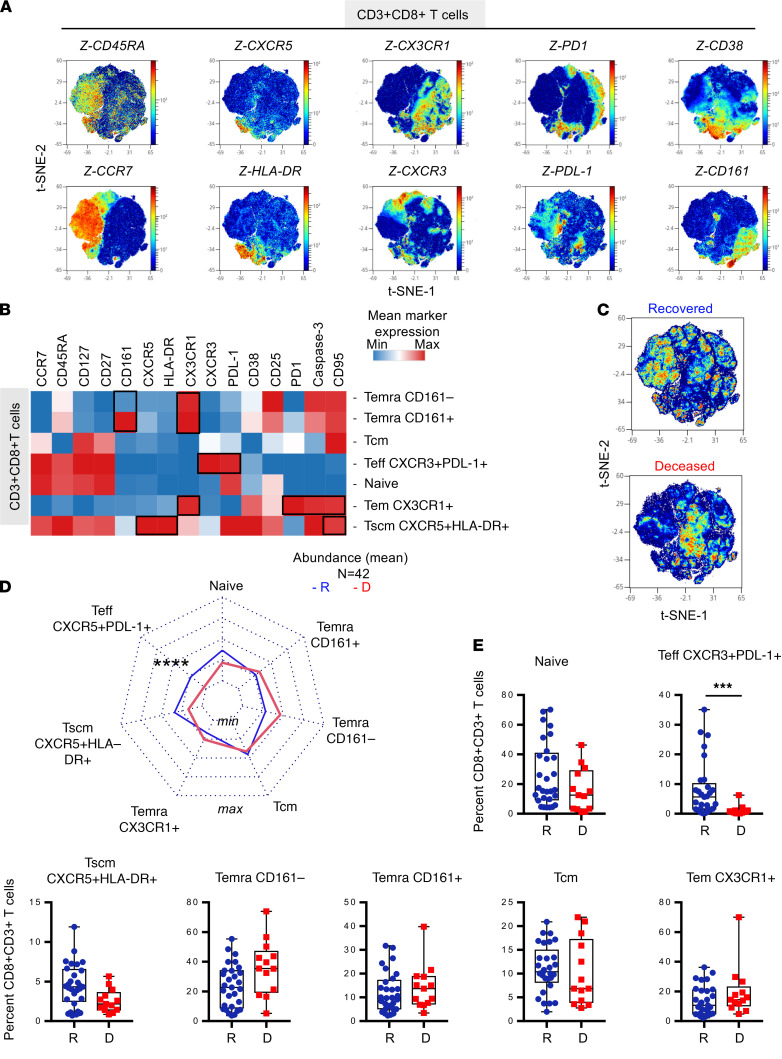
Figure 3. Surviving patients with COVID-19 have increased levels of PD-L1+CXCR3+CD8+ Teffs and CXCR5+HLA-DR+CD8+ Tscms.
PBMC samples were collected to assess T cell phenotypes (n = 42, R = 29, D = 13) using mass cytometry panel 1 (Supplemental Table 1). CD3+CD8+ T cells (50,000 events) were randomly taken among sample for unsupervised cluster using FlowSOM. (A) Density plot t-SNE representing the expression of indicated markers. (B) Heatmap representation of mean signal intensity of each marker in identified CD3+CD8+T cell population. (C) Density plot t-SNE representing abundance of events using concatenated files of 29 R and 13 D patients. (D) Radar representing mean (min/max normalized) abundance of CD3+CD8+T cell subsets in 29 R (blue) and 13 D (red) patients. (E) Box-and-whisker plots with min and max of CD3+CD8+T cell subset abundances in 29 R (blue) and 13 D (red) patients. All points are shown. Multiple Mann-Whitney U test using Benjamini, Krieger, and Yekutieli FDR correction was performed, with significance set at ***P <.001. Teffs, effector T cells; Tscm, stem cell memory T cell; R, recovered; D, deceased.

