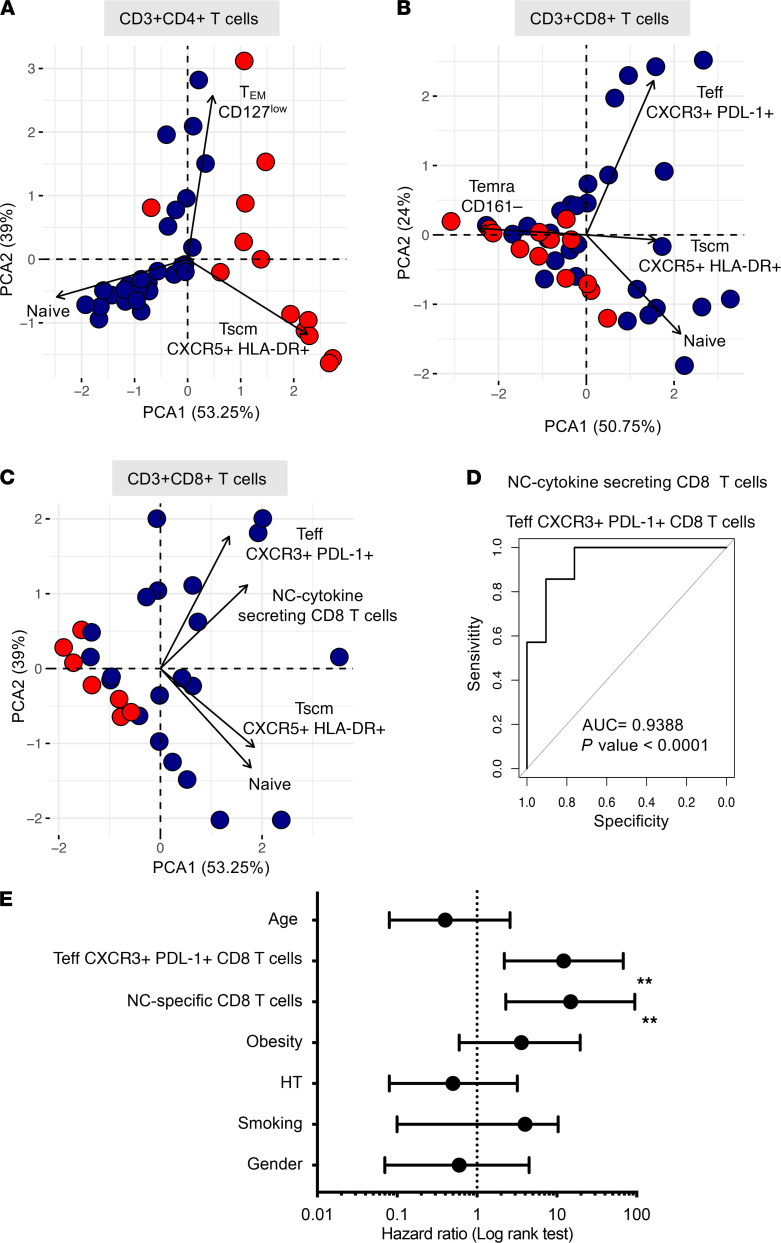
Figure 5. PCA of T cell frequencies discriminate survival and decreased ICU patients after critical SARS-CoV-2 infection.
PCA representations (R software) are as follows: (A) CD4+ T cell subset abundance and (B) CD8+ T cell subset abundance as indicated, and (C) CD8+ T cell subsets as indicated and frequency of NC-specific CD8+ T cells. Color code indicates patients who recovered (blue) and patients who deceased (red). (D) ROC curve (R software) modeling the abundance of PD-L1+CXCR3+ Teffs and NC-specific CD8+ T cells in disease survival or death outcomes. AUC = 0.9388, P < 0.001. (E) Forest plots comparing HR (Mantel-Haenszel) for death in 28 patients according to the abundance of PD-L1+CXCR3+ Teffs and NC-specific CD8+ T cells. Log rank (Mantel–Cox) test was used to compare HR between groups, with significance defined by a **P < 0.001. PCA, principal component analysis; ROC, receiver operating characteristic; NC, nucleocapsid; Teffs, effector T cells.

