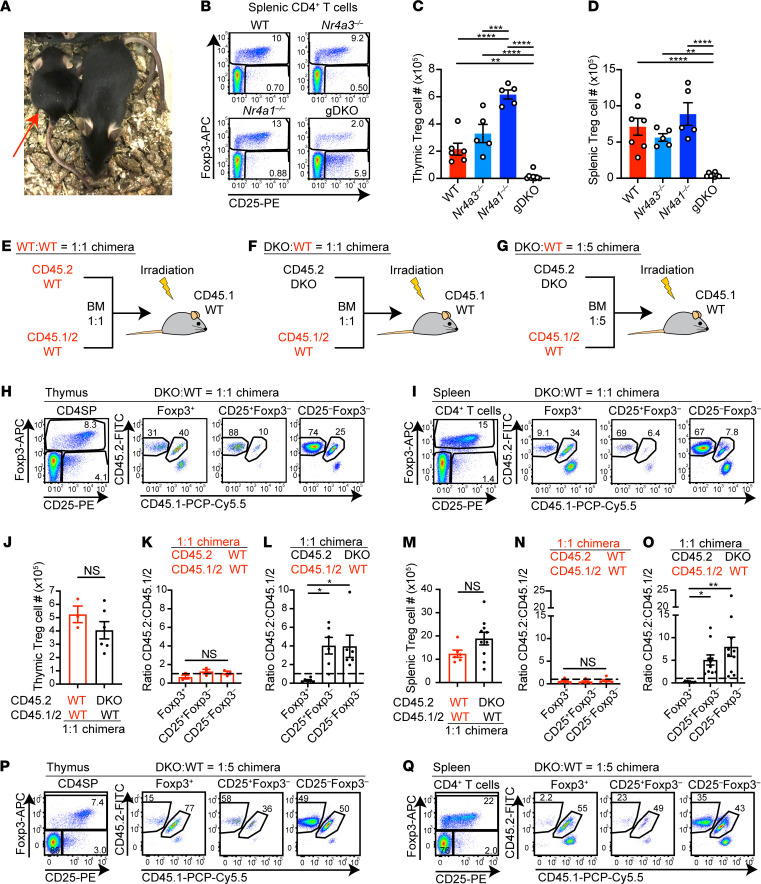
Figure 1. Systemic immune dysregulation and Treg deficiency in mice with germline deficiency of Nr4a1 and Nr4a3.
(A) Nr4a1–/–Nr4a3–/– (gDKO) mouse (red arrow) compared with healthy littermate, 4 weeks; representative of n = 8. (B) Flow plots show splenic CD4+ T cells with FOXP3+ Treg gate in mice of each genotype. Representative of 5 mice/genotype. (C and D) Quantification of thymic (C) and splenic (D) Treg cell number (n = 5, 3- to 4-week-old gDKO and 5- to 6-week-old mice with other genotypes). (E–G) Competitive BM chimera design. (H and I) Flow plots show thymic CD4 single-positive (CD4SP) (H) or splenic CD4+ T cell (I) subpopulations in 1:1 DKO:WT chimeras. Representative of 6 (H) or 10 (I) chimeras. (J–O) Quantification of thymic (J) or splenic (M) Treg cell number in 1:1 chimeras. Ratio of CD45.2 to CD45.1/2 for thymic (K and L) or splenic (N and O) Treg, CD25+FOXP3–, and CD25–FOXP3– cells in 1:1 chimeras, normalized to double-positive (DP) thymocytes. n = 3 (J–L) or 6 (M–O), pooled from 2 sets of independently generated chimeras 6–10 weeks posttransplant. (P and Q) Flow plots show thymic CD4SP (P) or splenic CD4+ T cell (Q) subpopulations in 1:5 DKO:WT chimera. Representative of ≥3 chimeras from 1 chimera setup. Graphs depict mean ± SEM. Statistical significance was assessed by 1-way ANOVA with Tukey’s test (C, D, K, L, N, and O) or 2-tailed unpaired Student’s t test (J and M). *P < 0.05; **P < 0.01; ***P < 0.001; ****P < 0.0001. NS, not significant.

