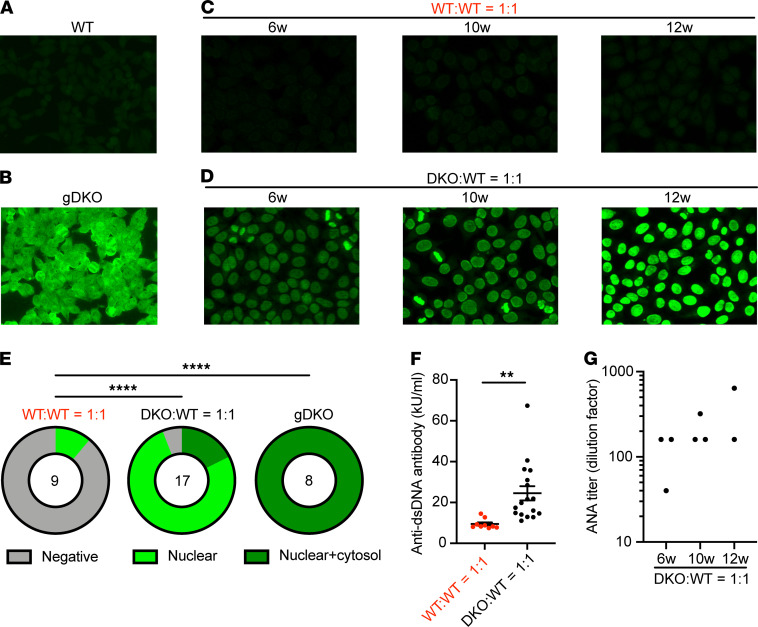
Figure 10. Restoring the Treg compartment in competitive chimeras alters autoantibody repertoire but does not restore tolerance.
(A–D) ANA immunofluorescence images — 1:40 diluted serum of indicated mice was applied to Hep-2 substrate slides, washed, and stained with FITC–anti–mouse IgG. Original magnification, 20×. Images are representative of biological replicates as quantified below (E and G). (E) Graphs depict frequency of negative, nuclear, or nuclear+cytoplasmic Hep-2 cell staining patterns in WT:WT = 1:1 chimera, DKO:WT = 1:1 chimera, and gDKO (1:40 dilution). Data include analysis of serum from 2 sets of independently generated chimeras 6 to 12 weeks posttransplant. Statistical significance was assessed by Fisher’s exact test. ****P < 0.0001. (F) Quantification of anti-dsDNA antibody from n = 9 WT:WT 1:1 chimeras and n = 17 DKO:WT 1:1 chimeras determined by ELISA, pooled from 2 sets of individually generated chimeras. Statistical significance was assessed by 2-tailed unpaired Student’s t test. **P < 0.01. (G) ANA titer determined with serial 2-fold dilution of serum from chimeras at indicated time points posttransplant stained as in A–D.

