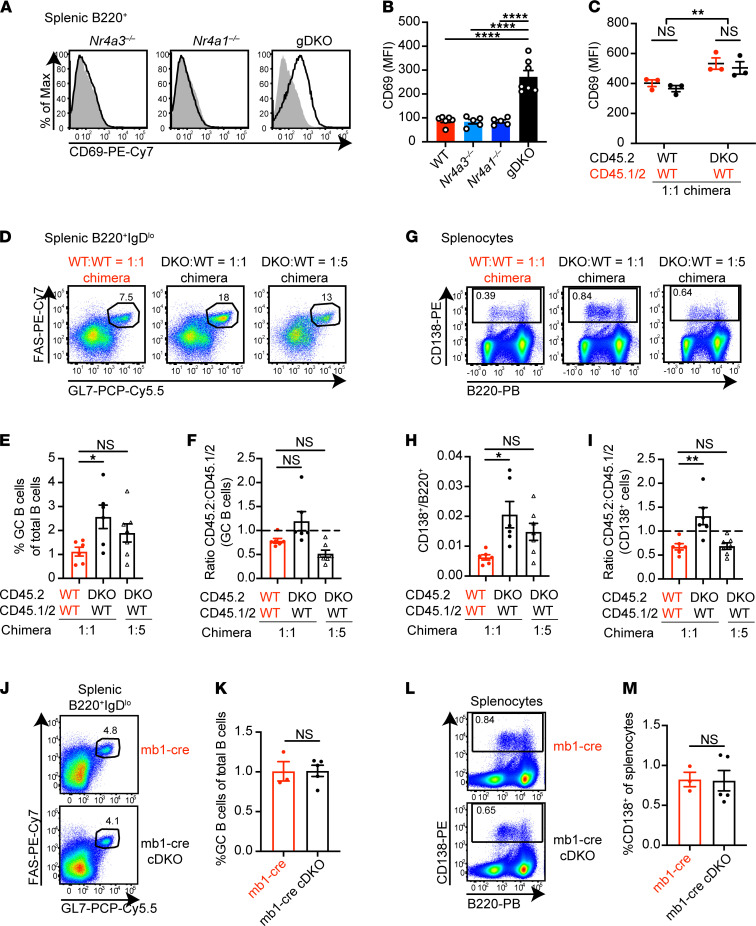
Figure 4. Abnormal B cell homeostasis in DKO mice is a non–cell-autonomous effect of NR4A deficiency.
(A) Representative flow plots showing CD69 expression on splenic B cells from WT (shaded gray histogram) and overlaid Nr4a3–/–, Nr4a1–/–, or gDKO mice. (B) Quantification of CD69 MFI as in A (data in A and B represent n ≥ 5, 3- to 4-week-old gDKO and 5- to 6-week-old mice of other genotypes). (C) Quantification of CD69 MFI on splenic B cells of each donor genotype in competitive 1:1 chimeras (n = 3 from 1 chimera setup). (D and G) Representative flow plots show FAShiGL7+ GC B cells pregated on B220+IgDlo splenocytes (D) and CD138+ splenocytes (G) from competitive chimeras. (E–I) Frequency of GC B cells among total B cells (E), ratio of CD45.2 to CD45.1/2 GC B cells normalized to B220+IgDhi naive B cells (F), ratio of CD138+ to B220+ splenocytes (H), ratio of CD45.2 to CD45.1/2 CD138+ cells normalized to B220+CD138– cells (I) from competitive chimeras as gated in D and G (data in D–I represent n ≥ 6 pooled from 3 sets of independently generated chimeras). (J–M) Representative flow plots show GC B cells (J) and CD138+ cells (L) in spleen from host chimeras transplanted with either mb1-cre or mb1-cre Nr4a1fl/fl Nr4a3–/– (cDKO) BM after 40 weeks. Frequency of GC B cells among total B cells (K) and CD138+ cells among splenocytes (M) (n ≥ 3). Graphs depict mean ± SEM. Statistical significance was assessed by 1-way ANOVA with Tukey’s test (B) or Dunnett’s test (E, F, H, and I) or 2-tailed unpaired Student’s t test with (C) or without (K and M) the Holm-Šídák method. *P < 0.05; **P < 0.01; ****P < 0.0001. NS, not significant.

