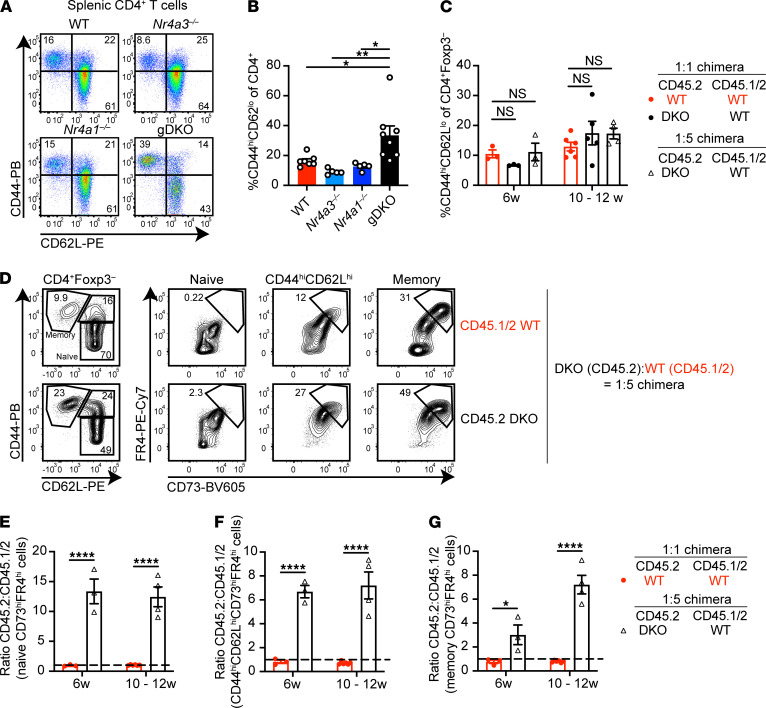
Figure 6. Accumulation of anergic DKO CD4+ T cells in competitive chimeras.
(A) Splenocytes from WT, Nr4a3–/–, Nr4a1–/–, and gDKO mice were stained to detect CD4+ T cell subsets on the basis of CD44 and CD62L expression. Plots are representative of ≥5 mice/genotype. (B) Quantification of splenic CD4+CD44hiCD62Llo T cells as gated in A (n ≥ 5, 3- to 4-week-old gDKO and 5- to 6-week-old mice of other genotypes). (C) Quantification of splenic FOXP3–CD4+CD44hiCD62Llo T cells as gated in Supplemental Figure 6A from competitive chimeras at indicated time points posttransplant (n ≥ 3, pooled from 2 sets of independently generated chimeras). (D) Splenocytes from 12 weeks posttransplant DKO:WT = 1:5 chimera were stained to detect anergic T cell subsets. Flow plots depict CD73hiFR4hi (anergic) T cells within CD44loCD62Lhi (naive), CD44hiCD62Lhi, and CD44hiCD62Llo (memory) compartments of CD4+FOXP3– cells of each donor genotype. Representative of 7 chimeras, generated in 1 set. (E–G) Ratio of CD45.2 to CD45.1/2 within CD73hiFR4hi gate among naive (E), CD44hiCD62Lhi (F), or memory (G) CD4+ T cell compartments, as gated in D. Shown are WT:WT = 1:1 and DKO:WT = 1:5 chimeras at indicated time points posttransplant (n ≥ 3 pooled from 2 sets of independently generated chimeras). Ratios were normalized to naive CD4+ T cells. Graphs depict mean ± SEM. Statistical significance was assessed by 1-way (B) ANOVA with Tukey’s test, 2-way ANOVA with Dunnett’s test (C), or 2-tailed unpaired Student’s t test with the Holm-Šídák method (E–G). *P < 0.05; **P < 0.01; ****P < 0.0001. NS, not significant.

