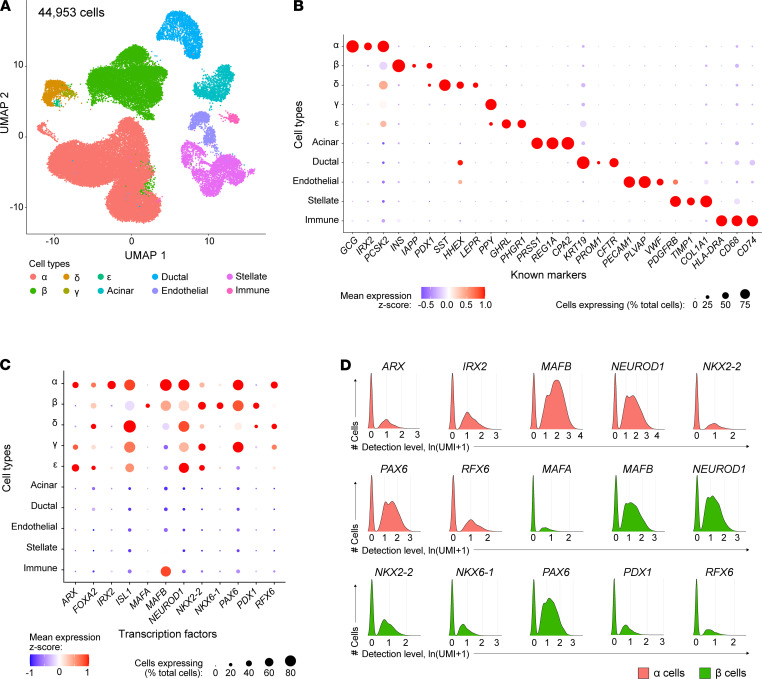
Figure 3. Transcription factor expression in human pancreatic islets by scRNA-Seq.
(A) UMAP visualization of 44,953 pancreatic islet cells from n = 5 islet preparations, identified by unsupervised clustering; cell populations include β (24%), α (54%), δ (2.5%), ε (0.08%), acinar (3.3%), ductal (4.7%), endothelial (2.2%), stellate (7.7%), and immune cells (0.5%). Cell clusters were annotated using known gene markers (Supplemental Table 2). Populations of γ and ε cells could not be resolved from the δ cell cluster; thus, these populations were manually selected using the “CellSelector” function to identify cells positive for PPY and GHRL, respectively. Libraries were sequenced at approximately 80,000 reads/cell yielding a median of 2365 genes per cell. (B) Dot plot showing relative expression of cell-type markers to validate cell-type annotation after unsupervised clustering. (C) Dot plot showing relative expression of transcription factors across all cell types. In B and C, dot size indicates the percentage of cells with detectable transcripts; color indicates gene’s mean expression z score. (D) Detected levels of common transcription factors expressed in α and β cells expressed as natural log (unique molecular identifiers per 10,000 + 1).

