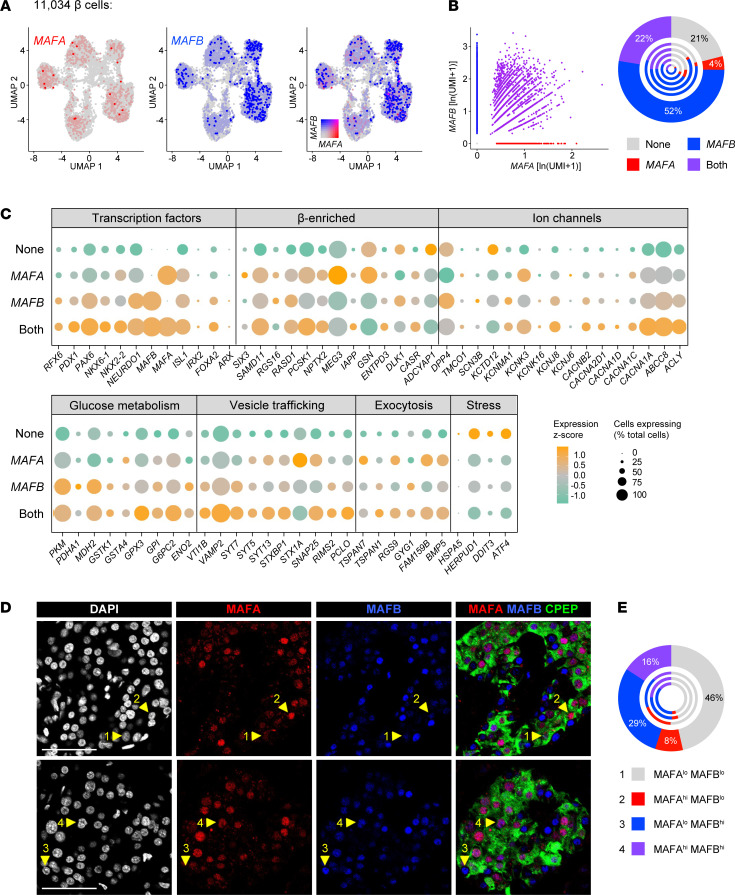
Figure 5. Heterogeneity of MAFA and MAFB expression in β cells by scRNA-Seq correlates with expression of key genes involved in β cell function.
(A) UMAP visualization of 11,034 β cells (n = 5 donors), pseudocolored to show detected expression, from left to right, of MAFA (red); MAFB (blue); and both MAFA and MAFB with 0.5 color threshold scale. (B) Scatterplot on the left depicts 4 distinct β cell populations based on detected expression (natural log of unique molecular identifiers per 10,000 + 1) of MAFA and MAFB: those expressing neither factor (22%), those expressing only MAFA (4%) or only MAFB (52%), and those coexpressing MAFA and MAFB (22%). Chart on the right shows cell populations by donor, with the outermost circle reflecting totals. (C) Dot plot showing the relative expression of selected genes related to β cell identity, ion flux, glucose metabolism, vesicle trafficking, exocytotic machinery, and cellular stress of the 4 β cell populations in B. Dot size indicates the percentage of β cells with detectable transcripts; color indicates the gene’s mean expression z score. See Supplemental Figure 7 for comparison to other single-cell studies. (D) Immunohistochemical staining of MAFA (red) and MAFB (blue) in C-peptide–expressing (CPEP-expressing) β cells (green) of a nondiabetic adult (55 years, Supplemental Table 4). Numbered arrowheads indicate the presence of 4 populations: 1, MAFAlo MAFBlo; 2, MAFAhi MAFBlo; 3, MAFAlo MAFBhi; 4, MAFAhi MAFBhi. (E) Quantification of β cell populations shown in D (n = 2566 β cells). Outermost circle represents composite count and inner circles represent β cells from each of n = 3 donors (see also Supplemental Figure 7B).

