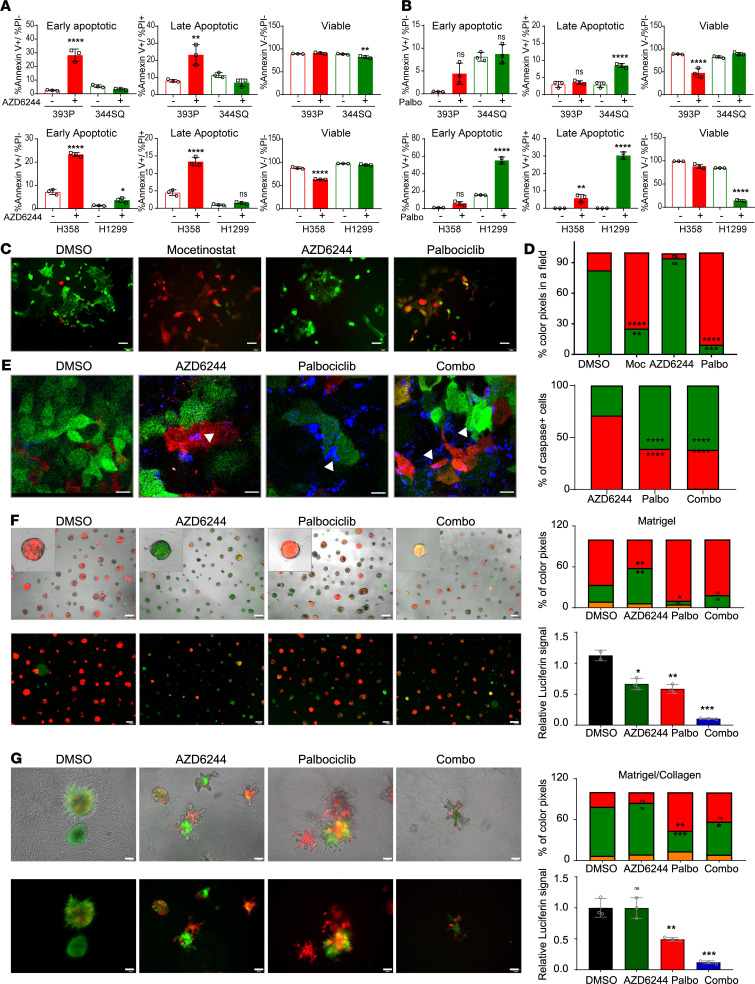
Figure 5. Cotargeting CDK4 and MAPK pathways targets different tumor cell subsets.
(A and B) Apoptosis was determined by annexin V and propidium iodide staining after treatment with AZD6244 (5 μM) or palbociclib (5 μM) for 48 hours. Data are presented as the mean ± SD. (C) 344SQ_Z-cad cells were treated with DMSO, mocetinostat (1 μM), AZD6244 (5 μM), or palbociclib (5 μM) for 48 hours followed by fluorescent image acquisition. Scale bar: 50 μm. (D) Images from C were quantified for the percentage of RFP or GFP colored pixels calculated per field of view (FOV). n = 4–6 FOVs. (E) 344SQ_Z-cad cells were treated with DMSO, AZD6244 (5 μM), palbociclib (5 μM), or the combination. NucView 405 Caspase 3 substrate was added to each condition as a readout for apoptosis. Representative fluorescent images were acquired 48 hours after addition of drugs. Scale bar: 25 μm. Arrows indicate apoptotic cells. Images were quantified for total caspase-3+ cells as a percentage of total cells in 4–6 FOVs. (F and G) EVTs were plated in a Matrigel (MG) or a collagen/Matrigel (Coll/MG). After 24 hours, EVTs were treated with DMSO, AZD6244 (5 μM), palbociclib (5 μM), or the combination. Treatment in MG was continued for 9 days and Coll/MG for 5 days, with representative images from last day of the culture shown (scale bar: 200 μm for MG and 100 μm for Coll/MG). Red color indicates epithelial-like cells and green color indicates mesenchymal-like cells. Quantification of percentage RFP and GFP colored pixels in 4–6 FOVs. Data are represented as mean. At the end of the treatment, CellTiter-Glo reagent was added and relative luciferin signal was measured. Treatment groups were compared with DMSO using 1-way ANOVA in all the panels. ****P < 0.0001; ***P < 0.005; **P < 0.001; *P < 0.05.

