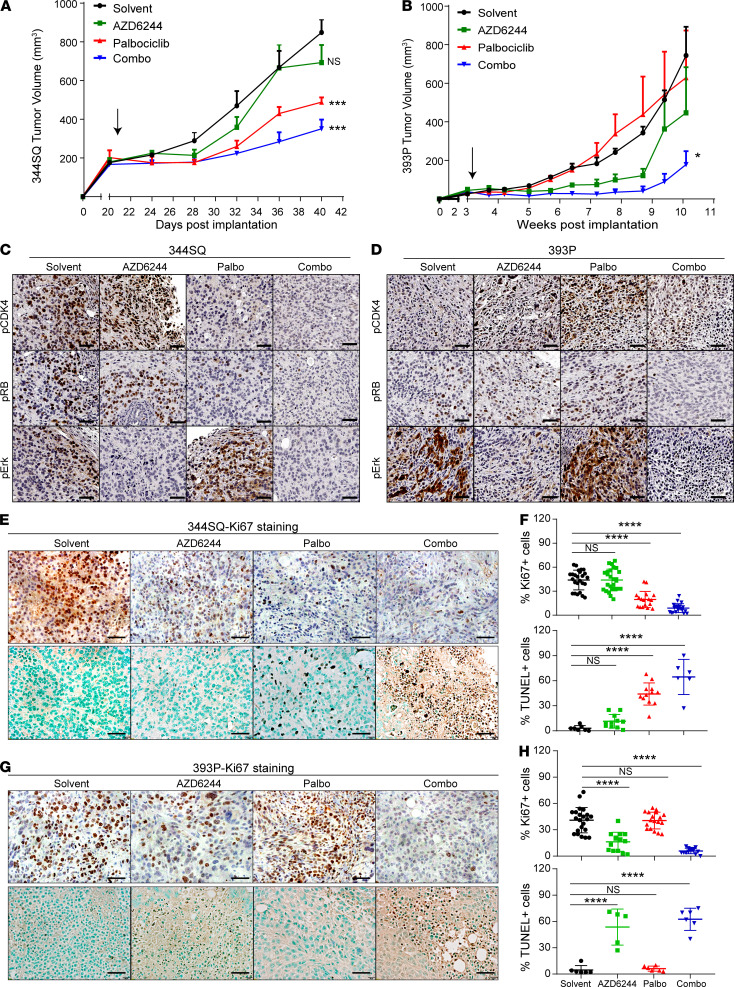
Figure 6. Combination of MEK and CDK4 inhibitors controls syngeneic tumor growth and prevents emergence of EMT-mediated resistance.
(A) In vivo volume measurements at the indicated time points for 344SQ subcutaneous tumors in syngeneic WT mice (n = 5 per group) after daily treatment with solvent, AZD6244 (25 mg/kg), palbociclib (50 mg/kg), or combination. Arrow indicates start of the treatment. (B) In vivo volume measurements at indicated time points for 393P subcutaneous tumors in syngeneic WT mice (n = 5 per group) after daily treatment with solvent, AZD6244 (25 mg/kg), palbociclib (50 mg/kg), or combination. Arrow indicates start of treatment. (C and D) IHC analysis on 344SQ and 393P tumors harvested from A and B, respectively, with indicated markers. Scale bar: 50 μm. (E–H) Tumors from the experiments described in A and B were stained with Ki67 and TUNEL assay to measure cell proliferation and cell death respectively. Representative IHC images are shown (E and G). Scale bar: 50 μm. Images were quantified for Ki67 and TUNEL staining in each treatment group. n = 2–3 per group with 3–6 FOVs per mouse. Data are presented as mean ± SD. Statistical significance was determined by 1-way ANOVA in all the panels. ****P < 0.0001; ***P < 0.005; *P < 0.05.

