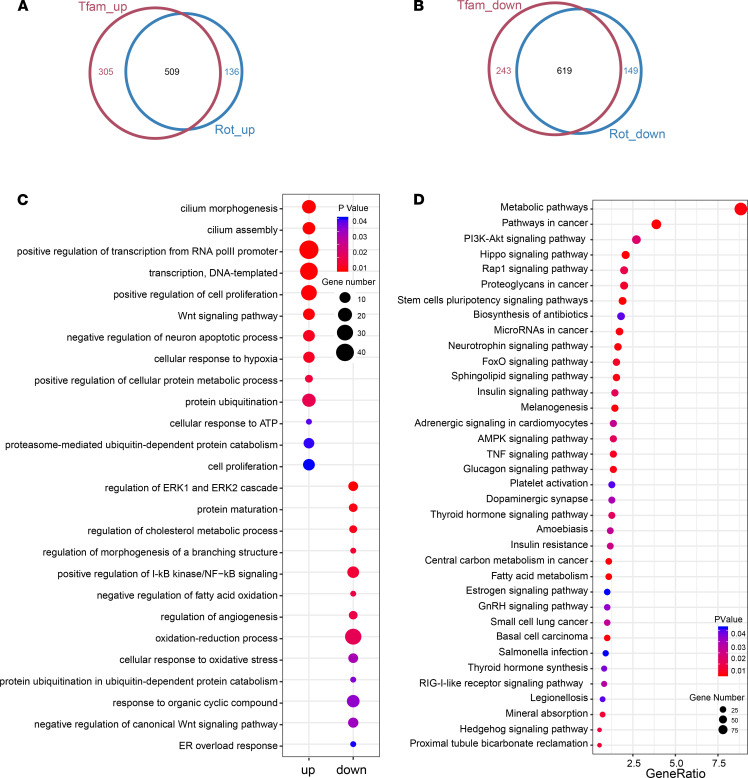
Figure 3. Rotenone-exposed and TFAM-KO N27 DAergic neuronal cells share similar transcriptomic alterations.
Venn diagrams highlighting (A) upregulated and (B) downregulated DEGs shared between rotenone-treated and TFAM-KO N27s. (C) GO analysis revealing the top 12 biological processes enriched by upregulated genes (left) and downregulated genes (right) overlapping between rotenone treatment and TFAM KO. (D) KEGG pathway analysis identifying the most significant pathways for common, enriched DEGs.

