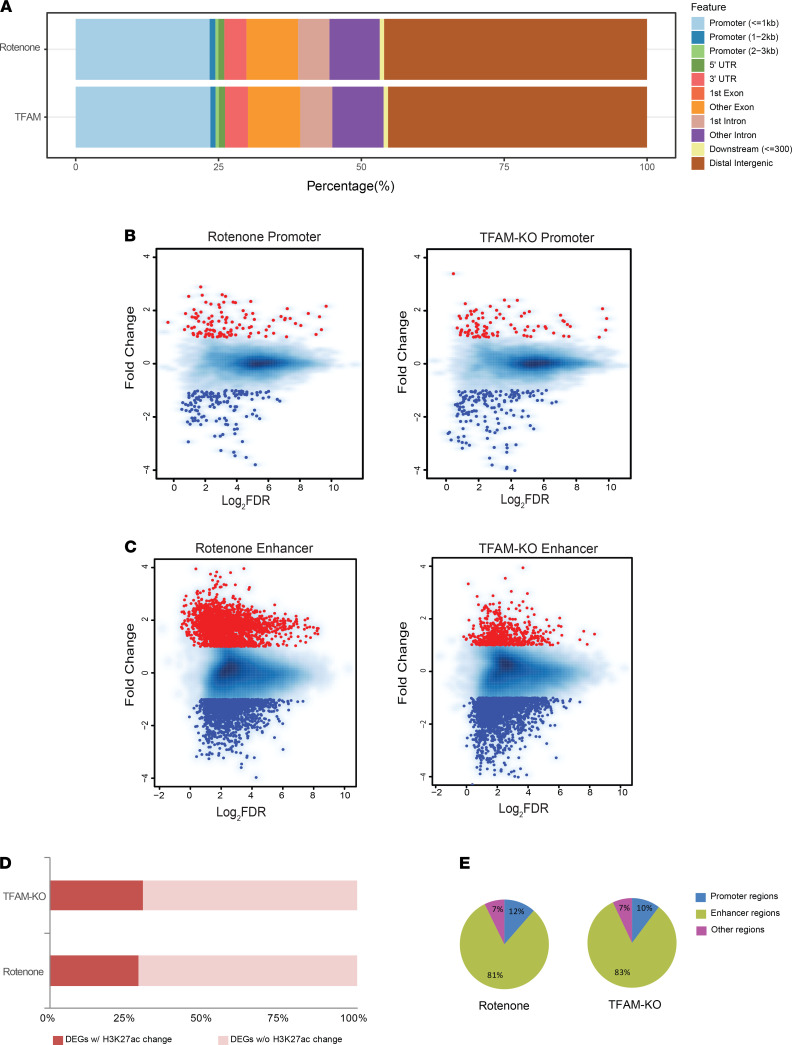
Figure 4. Identification of vulnerable genomic loci binding with H3K27ac in rotenone-treated and TFAM-KO N27 cells.
(A) Bar chart indicating the similar genomic distribution of H3K27ac sites in 2 models after intragroup normalization. (B) Scatter plots showing H3K27ac peaks located at gene promoter regions in rotenone-treated and TFAM-KO N27 neurons when compared with their respective control. (C) Scatter plots showing H3K27ac peaks located at enhancer regions in rotenone-treated and TFAM-KO N27 neurons when compared with their respective control. Each point represents a peak and most points cluster in the middle. The dots indicate upregulated (red) and downregulated (blue) H3K27ac peaks. (D) Bar plot showing the proportion of differentially expressed genes (DEGs) with a consistent change in H3K27ac enrichment in both models. (E) Pie charts indicating the genomic features of those altered H3K27ac peaks in both models.

