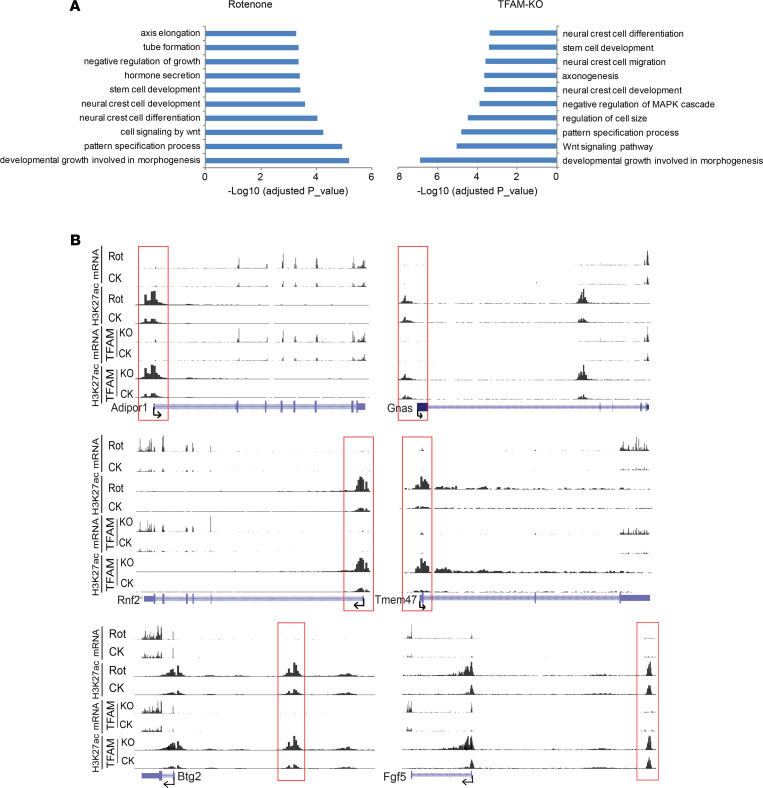
Figure 5. Identification of H3K27ac-specific enhancers in rotenone-treated and TFAM-KO N27 cells.
(A) GO biological processes associated with differentially expressed genes (DEGs) of differentially enriched H3K27ac in both models. (B) Representative distribution of reads obtained by ChIP-Seq and RNA-Seq in selected gene loci related to mitochondrial dysfunction and neural function in N27 cells. Red rectangular boxes indicate promoter or enhancer regions. The distribution of H3K27ac was normalized to input and library dimension. Uniform scales are used for H3K27ac and for mRNA. CK, vehicle control; TFAM KO, TFAM KO by CRISPR/Cas 9; TFAM CK, TFAM CRISPR control.

