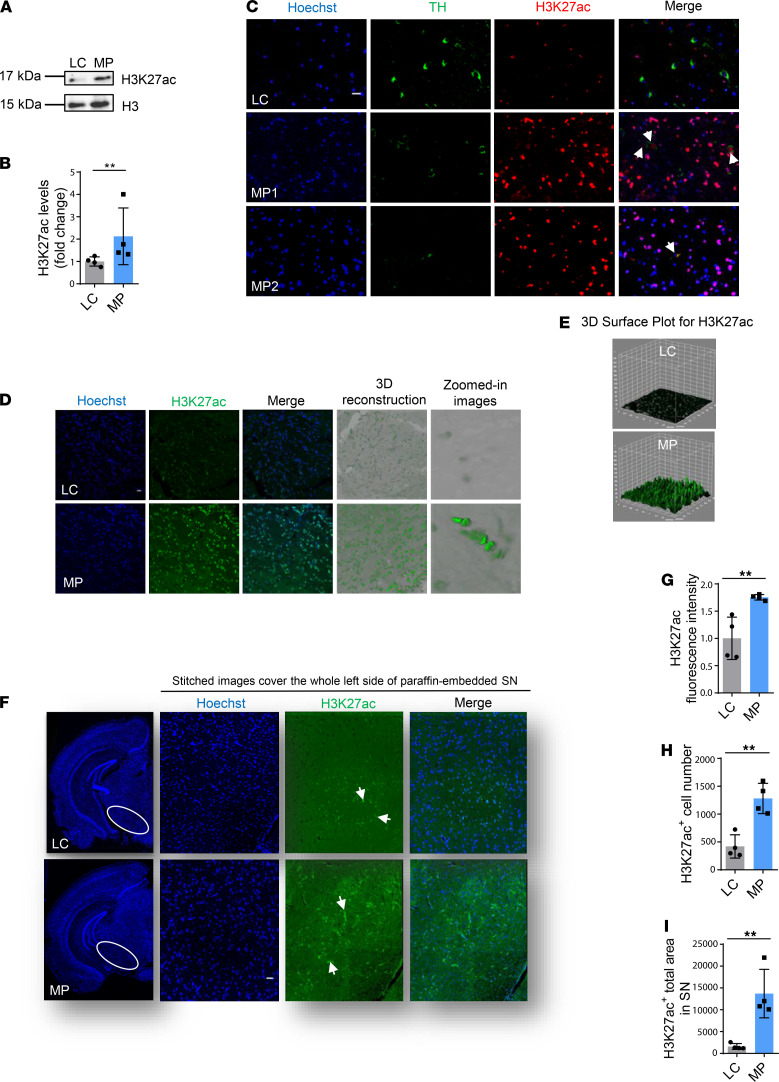
Figure 7. Elevated H3K27ac in substantia nigra of MitoPark mice.
(A) Representative immunoblots and (B) their quantification from MitoPark (MP) and littermate control (LC) mice. Mann-Whitney test (n = 4). (C) Zoomed-in images (scale bar: 5 μm) of 7-μm-thick paraffin-embedded sections (shown in Supplemental Figure 6G) with H3K27ac in red, nucleus in blue, and TH in green. MP1 shows not only colocalization of TH and H3K27ac but also several degrading TH neurons, whereas MP2 reveals degraded TH neurons and minimal colocalization. Arrows denote colocalization of H3K27ac and TH. (D) Confocal images of 30-μm free-floating sections from same-aged mice with H3K27ac in green and nucleus in blue. Scale bar: 5 μm. (E) 3D surface plot analysis for H3K27ac. (F) Images stitched together from 150 images (original magnification, ×60) showing the entire region of the substantia nigra (SN) (H3K27ac, green; nucleus, blue). Arrows denote H3K27ac. Scale bar: 400 μm. (G) Quantified fluorescence intensity for H3K27ac. (H) Count of cells stained with H3K27ac. (I) Area of SN with cells stained with H3K27ac. Each data point is the average of 3 replicates. For IHC of substantia nigra, n = 11–12. Independent experiments were repeated 4 times. Bar graphs show mean ± SEM; unpaired 2-tailed Student’s t test. NS, not significant. **P < 0.01.

