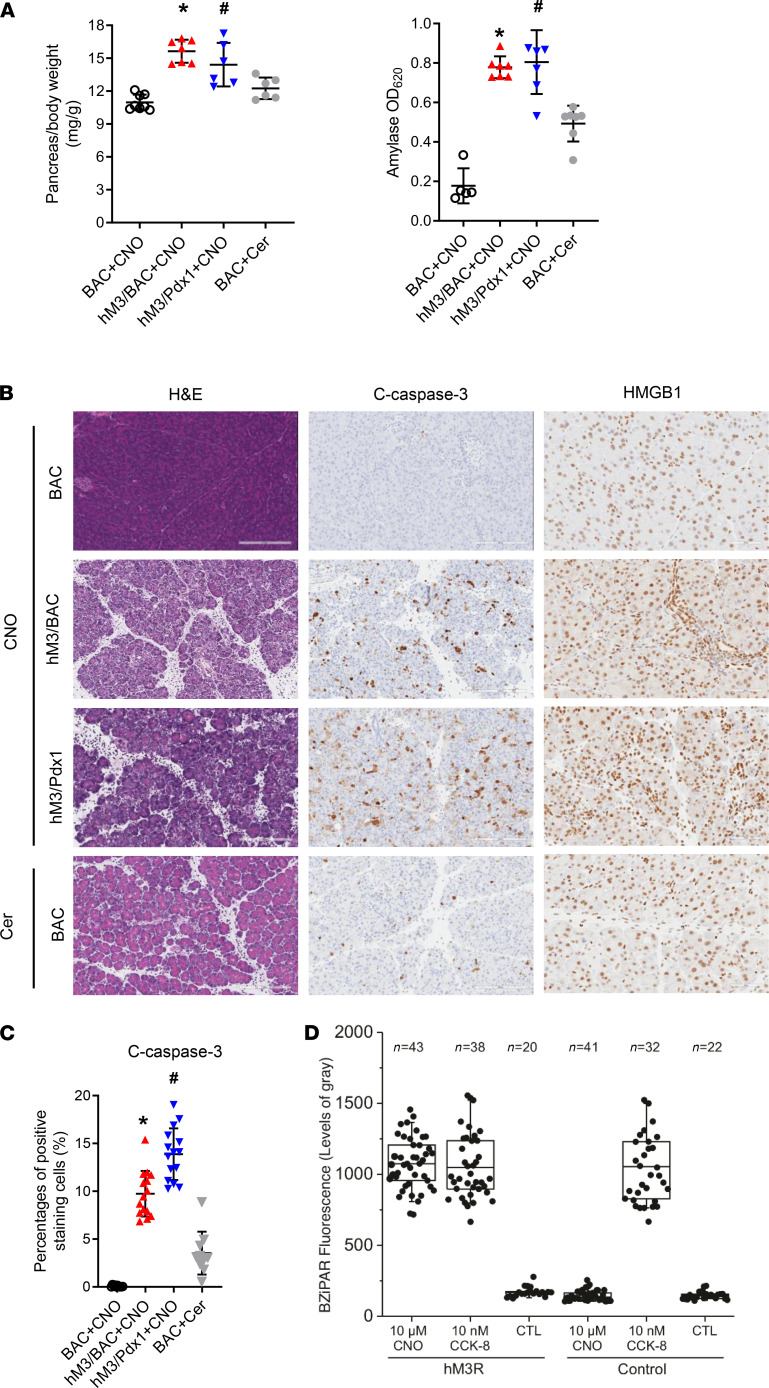
Figure 4. CNO induced more severe AP than cerulein.
(A) Mice were injected with a single dose of CNO (6 mg/kg, ip) or 8 times of cerulein (100 μg/kg, ip) following tamoxifen treatment. Pancreatic edema and serum amylase were measured and compared. hM3R/Pdx1-Cre (hM3/Pdx1) double transgenic mice were included for comparison. Mean ± SEM (n = 6–8). (B) HE, IHC for cleaved caspase-3 (apoptosis), and HMGB1 (necrosis) staining of pancreatic tissues (scale bar: 200 μm). (C) Quantification of cleaved caspase-3 was calculated using ImageScope software. Mean ± SEM (n = 6–8). *P 0.05, hM3/BAC+CNO group vs. BAC+Cer group. #P 0.05, hM3/Pdx1+CNO group vs. BAC+Cer group. Two-way ANOVA with Tukey’s test. (D) Trypsinogen activation was measured by BZiPAR fluorescence in control or acini expressing mutant hM3R. The box plots depict the minimum and maximum values (whiskers), the upper and lower quartiles, and the median. The length of the box represents the interquartile range.

