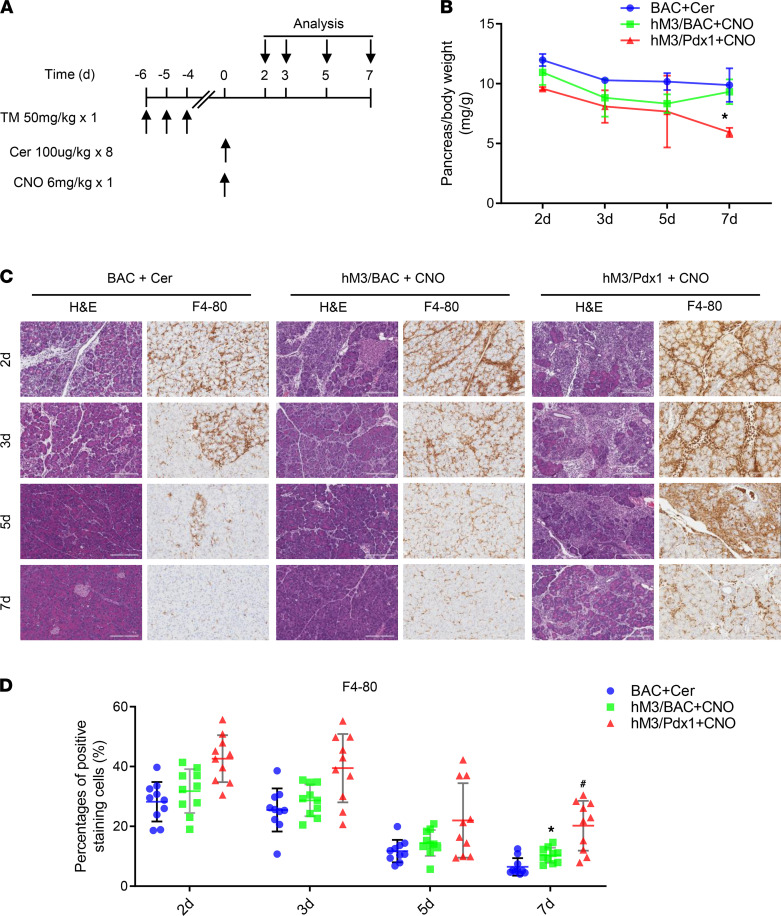
Figure 5. Pancreatitis recovery in cerulein-inducing BAC mice, CNO-inducing hM3/BAC, and hM3/Pdx1 mice.
(A) Mice were injected with a single dose of CNO (6 mg/kg, ip) or 8 times of cerulein (100 μg/kg, ip) following tamoxifen treatment. (B) The pancreas shrinkage was measured following AP induction at indicated time points. Mean ± SEM (n = 3–5). *P 0.05, hM3/Pdx1+CNO group vs. BAC+Cer group. Two-way ANOVA with Tukey’s test. (C) Pancreas pathology was revealed by HE and F4-80 staining (scale bar: 200 μm). (D) Quantification of F4-80–positive cells. Mean ± SEM (n = 3–5). *P 0.05, hM3/BAC+CNO group vs. BAC+Cer group. #P 0.05, hM3/Pdx1+CNO group vs. BAC+Cer group. Two-way ANOVA with Tukey’s test.

