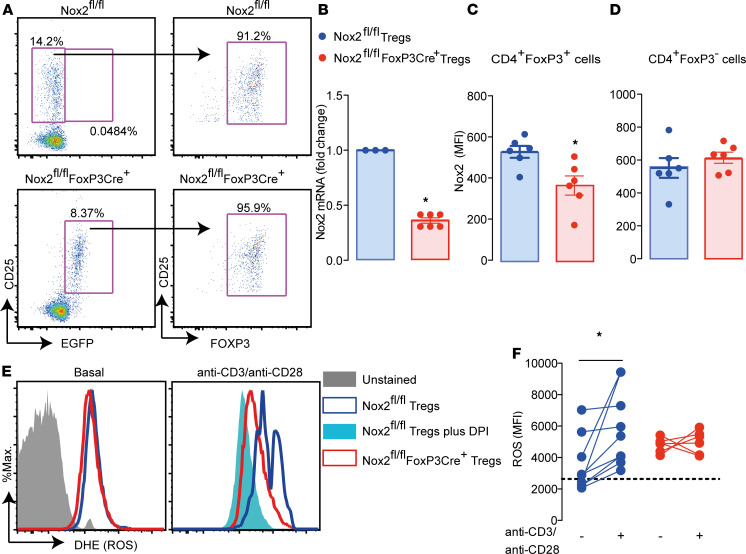
Figure 1. Generation of mice with Treg-targeted Nox2 deletion.
(A) EGFP+ cells from lymph nodes of Nox2fl/flFoxP3Cre+ mice stained with CD25 and FoxP3 antibodies. Plots are representative of 3 Nox2fl/flFoxP3Cre+ and 3 Nox2fl/fl mice. (B) Nox2 mRNA levels in lymph nodes (n = 3–6 per group). (C and D) Nox2 protein levels in CD4+FoxP3+ and CD4+FoxP3– cells, respectively (n = 6 per group). (E and F) ROS estimated by dihydroethidium (DHE) fluorescence in purified Tregs stimulated with anti-CD3 (4 μg/ml) and anti-CD28 (8 μg/ml) antibody (n = 4–7 per group). Representative histograms are shown in E, and mean data is displayed in F. The dashed line in F represents the MFI of Nox2fl/fl cells preincubated with the flavoprotein inhibitor diphenyleneiodonium (DPI; 10 μM) 30 minutes before stimuli. Data are shown as mean ± SEM. *P < 0.05 for indicated comparisons, Mann Whitney 2-tailed t test in B–D and Kruskal-Wallis followed by Dunn’s post test in F.

