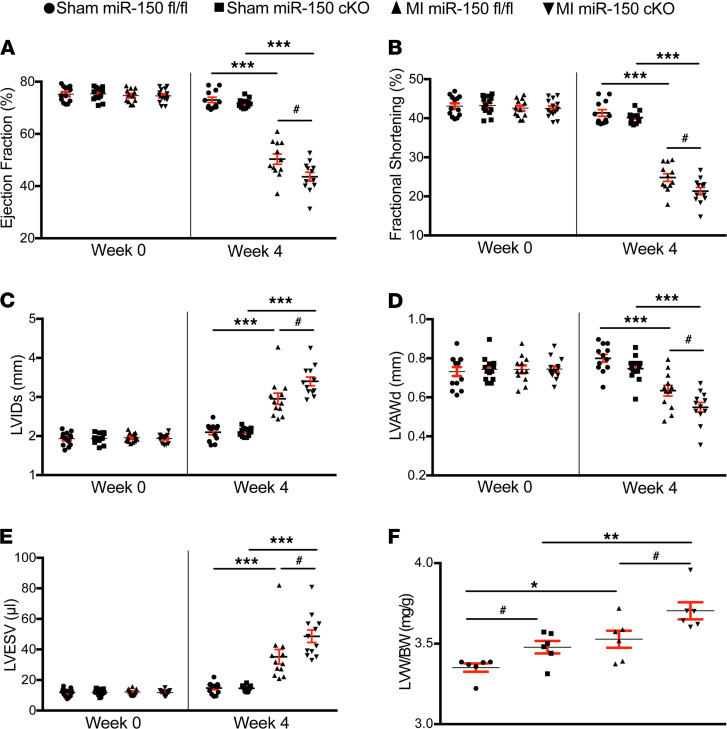
Figure 1. miR-150 selectively in cardiomyocytes protects the mouse heart against MI.
(A–E) Transthoracic echocardiography was performed at 0 and 4 weeks after MI. Quantification of left ventricular (LV) ejection fraction (EF); fractional shortening (FS); internal diameter, systole (LVIDs); anterior wall thickness, diastole (LVAWd); and end systolic volume (LVESV) is shown. n = 12–14 per group. One-way ANOVA with Tukey multiple-comparison test. ***P < 0.001 versus sham; #P < 0.05 versus MI miR-150fl/fl. (F) Left ventricle weight/body weight (LVW/BW) ratio (n = 6). One-way ANOVA with Tukey multiple-comparison test. *P < 0.05 or **P < 0.01 versus Sham; #P < 0.05 versus miR-150fl/fl. Data are presented as mean ± SEM.

