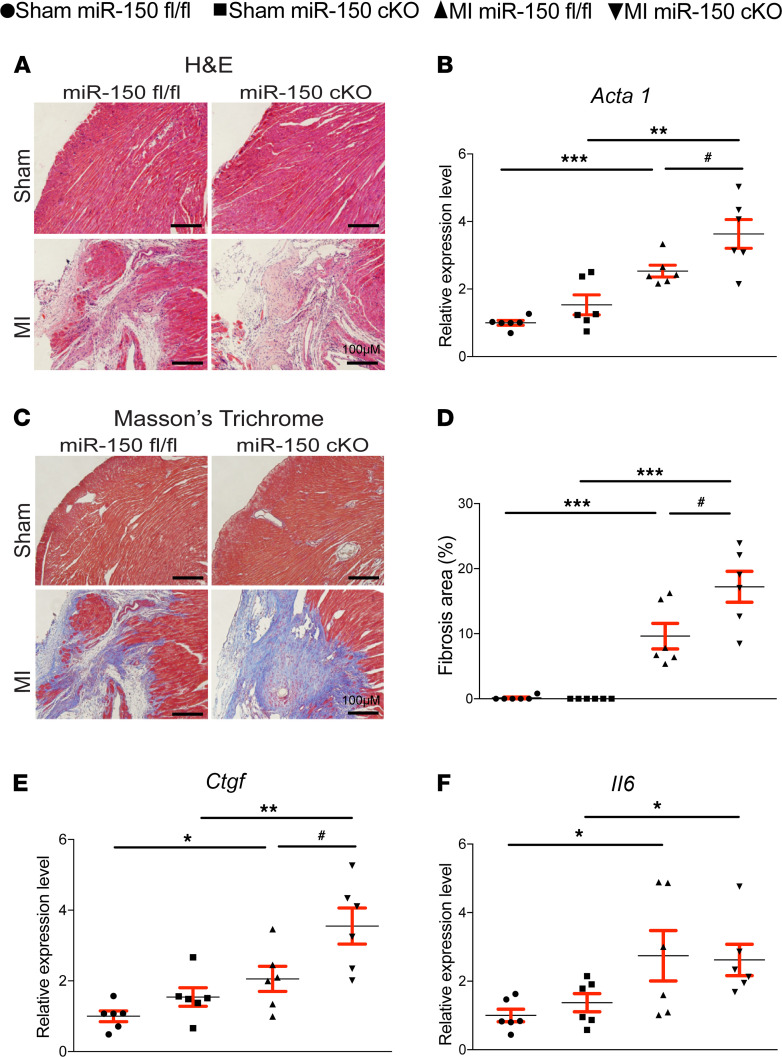
Figure 2. Selective deletion of miR-150 in cardiomyocytes induces cardiac stress and fibrosis after MI.
(A) Representative H&E staining of heart sections of periischemic border area at 4 weeks after MI shows an increase in loss of normal architecture and cellular integrity, as well as in disorganized structure in miR-150 cKO hearts compared with miR-150fl/fl controls. Scale bars: 100 μm. (B) qPCR analysis of Acta1 expression for cardiac stress in miR-150 cKO hearts compared with miR-150fl/fl controls at 4 weeks after MI. (C and D) Representative Masson’s trichrome staining (C) in heart sections of periischemic border area at 4 weeks after MI and fibrosis quantification in LVs (D). Scale bars: 100 μm. (E and F) qPCR analysis of fibrotic Ctgf and inflammatory Il6 expression in miR-150 cKO hearts compared with miR-150fl/fl controls at 4 weeks after MI. n = 6 per group. qPCR data (B, E, and F) are shown as fold induction of gene expression normalized to Gapdh. One-way ANOVA with Tukey multiple-comparison test. *P < 0.05, **P < 0.01 or ***P < 0.001 versus sham; #P < 0.05 versus MI miR-150fl/fl. Data are presented as mean ± SEM.

