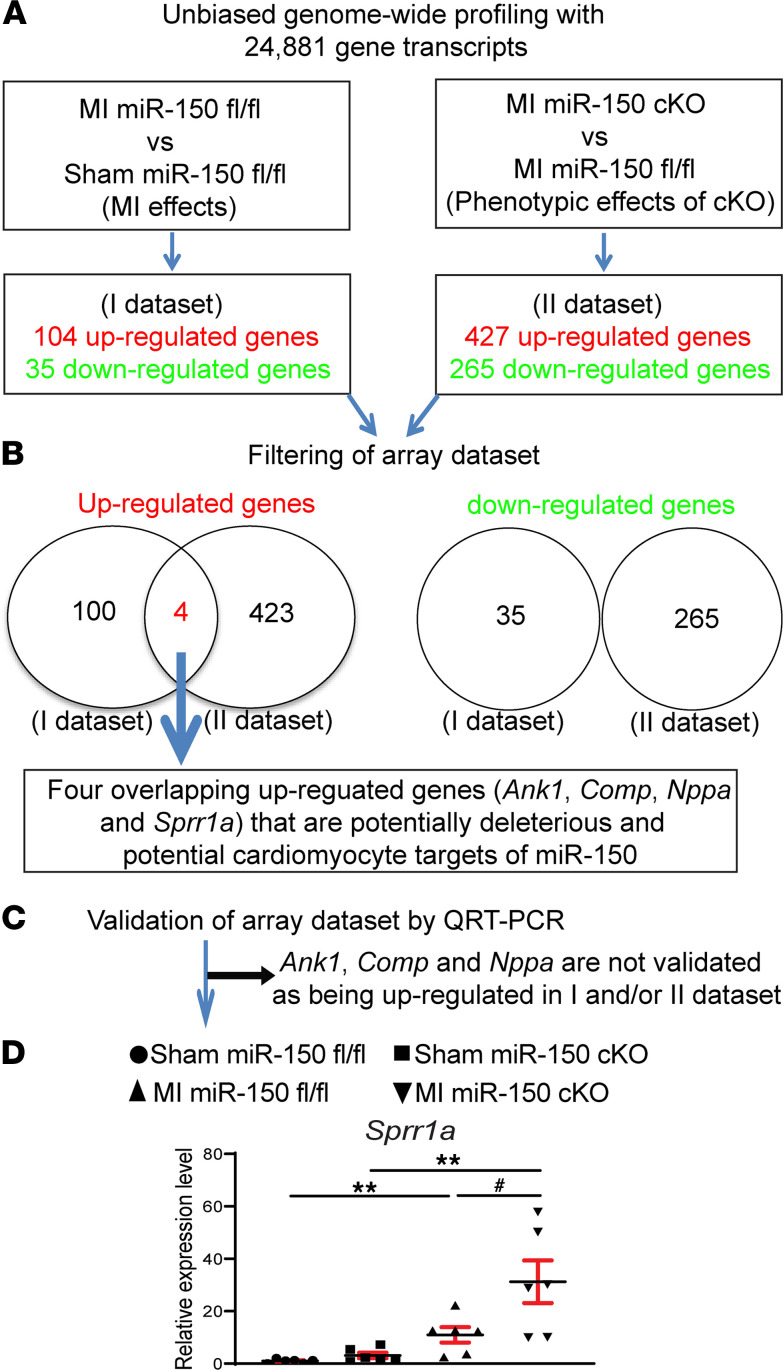
Figure 4. Transcriptome profiling in miR-150 cKO mice identifies Sprr1a as a target of miR-150.
(A and B) Transcriptome profiling (A) and filtering strategy of array data set based on the correlation between cardiac phenotypes and transcript signatures (B). Four dysregulated (DE) genes, which are upregulated in both the I data set (MI miR-150fl/fl compared with sham miR-150fl/fl controls) and the II data set (MI miR-150 cKO compared with MI miR-150fl/fl) at 4 weeks after MI, were chosen for further analyses. Note that there are no overlapping downregulated genes in I data set and II data set. n = 3 per group. (C and D) Validation strategy of array data set. Four DE genes (Ank1, Comp, Nppa, and Sprr1a) were validated by qPCR analyses of potentially deleterious genes in hearts from miR-150fl/fl and miR-150 cKO mice at 4 weeks after MI. Note that Ank1, Comp, and Nppa are not validated to be upregulated in I data set and/or II data set by qPCR analyses. Data are shown as fold induction of gene expression normalized to Gapdh. n = 6 per group. One-way ANOVA with Tukey multiple-comparison test. **P < 0.05 versus sham; #P < 0.05 versus MI miR-150fl/fl. Data are presented as mean ± SEM.

