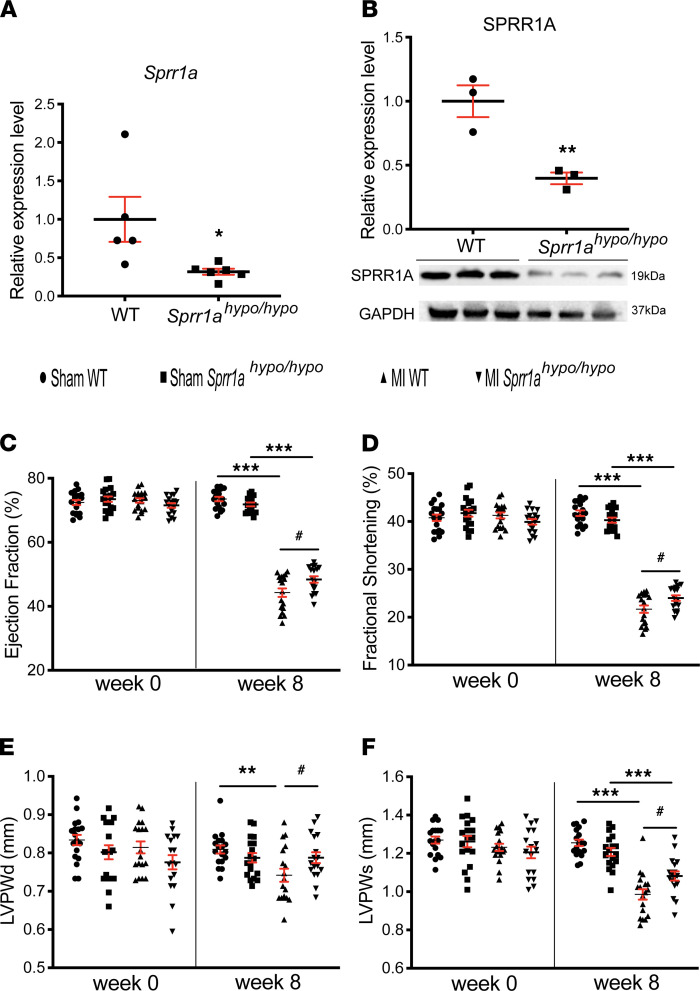
Figure 6. Knockdown of Sprr1a protects the mouse heart against MI.
(A) qPCR expression analysis of Sprr1a in heart tissues from Sprr1ahypo/hypo mice (n = 6) relative to WT controls (n = 5). Data are shown as fold change of gene expression normalized to Gapdh. Unpaired 2-tailed t test. *P < 0.05 versus WT. (B) SPRR1A protein levels were measured in whole heart lysates from Sprr1ahypo/hypo mice compared with WT. Results are from 3 different biological samples. Unpaired 2-tailed t test. **P < 0.01 versus WT. (C–F) Transthoracic echocardiography was performed at 0 and 8 weeks after MI. Quantification of LV ejection fraction (C); fractional shortening (D); posterior wall thickness, diastole (LVPWd) (E); and posterior wall thickness, systole (LVPWs) (F). n = 17–18 per group. One-way ANOVA with Tukey multiple-comparison test. **P < 0.01 or ***P < 0.001 versus Sham; #P < 0.05 versus MI WT. Data are presented as mean ± SEM.

