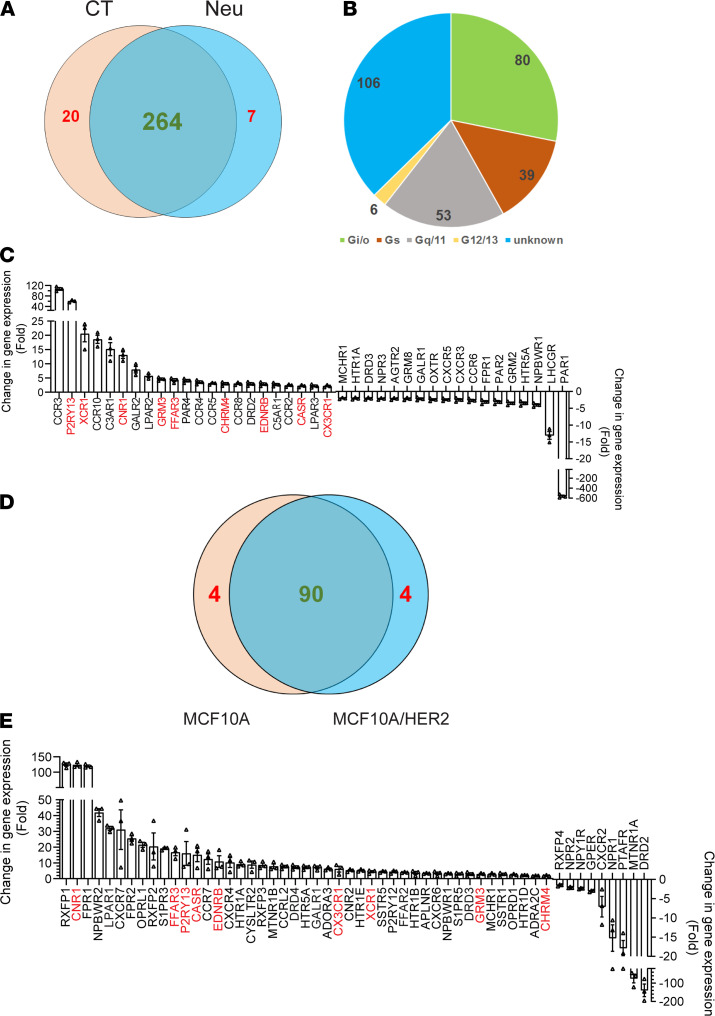
Figure 1. HER2 regulates GPCR expression in mammary epithelial cells.
(A) Venn diagram showing the number of GPCRs expressed in control and Neu cells. (B) G protein linkage of GPCRs expressed in common in control and Neu cells. (C) The Gi/o-GPCRs showing more than a 2-fold change of expression in Neu cells as compared with control cells. Data are expressed as mean ± SEM, n = 3. (D) Venn diagram showing the number of Gi/o-GPCRs expressed in MCF10A and MCF10A/HER2 cells. (E) The Gi/o-GPCRs showing more than a 2-fold change of expression in MCF10A/HER2 cells as compared with control cells. Data are expressed as mean ± SEM, n = 3. The common GPCRs upregulated in Neu and MCF10A/HER2 cells are highlighted in red.

