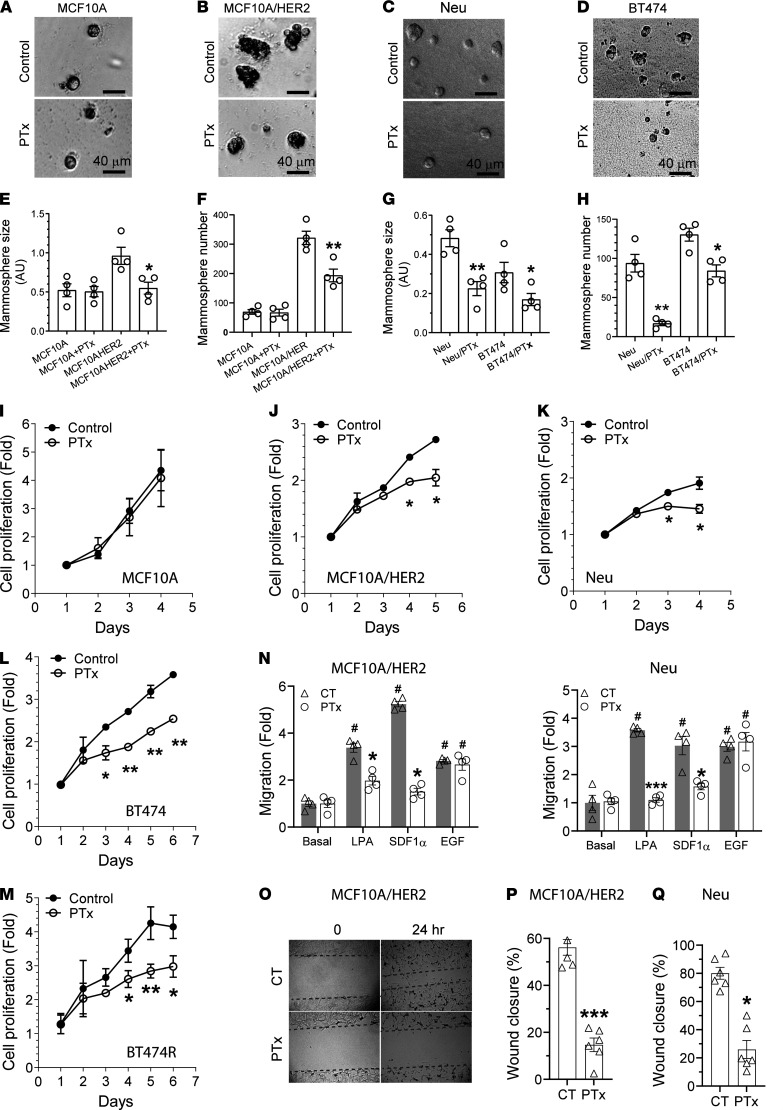
Figure 2. Gi/o-GPCR signaling regulates the growth and migration of HER2+ mammary epithelial cells.
(A–D) Representative images showing MCF10A (A), MCF10A/HER2 (B), Neu (C), and BT474 (D) cells grown in Matrigel treated with vehicle control (CT) or PTx (0.2 μg/ml). Scale bar: 40 μm. (E–H) Quantitative data showing the size (E and G) and number (F and H) of MCF10A, MCF10A/HER2, Neu, and BT474 mammospheres. *P < 0.05, **P < 0.01, ***P < 0.001, vs. MCF10A/HER2, Neu, or BT474, n = 4. (I–N) The effect of PTx treatment on proliferation (I–M) and LPA-, SDF1α-, and EGF-induced Transwell migration (N) of the indicated cells. *P < 0.05, **P < 0.01, ***P < 0.001 vs. control; #P < 0.05 vs. basal; n = 4–6. (O) Representative images showing the size of the wound at 0 and 24 hours in MCF10A/HER2 cells treated with vehicle control or PTx. Original magnification, ×10. (P and Q) Quantitative data showing the effect of PTx on wound healing in MCF10A/HER2 (P) and Neu (Q) cells. *P < 0.05, ***P < 0.001 vs. control, n = 4–6. Two-tailed unpaired Student’s t test was used for all statistical analysis in this figure, except for N, which was analyzed by two-way ANOVA.

