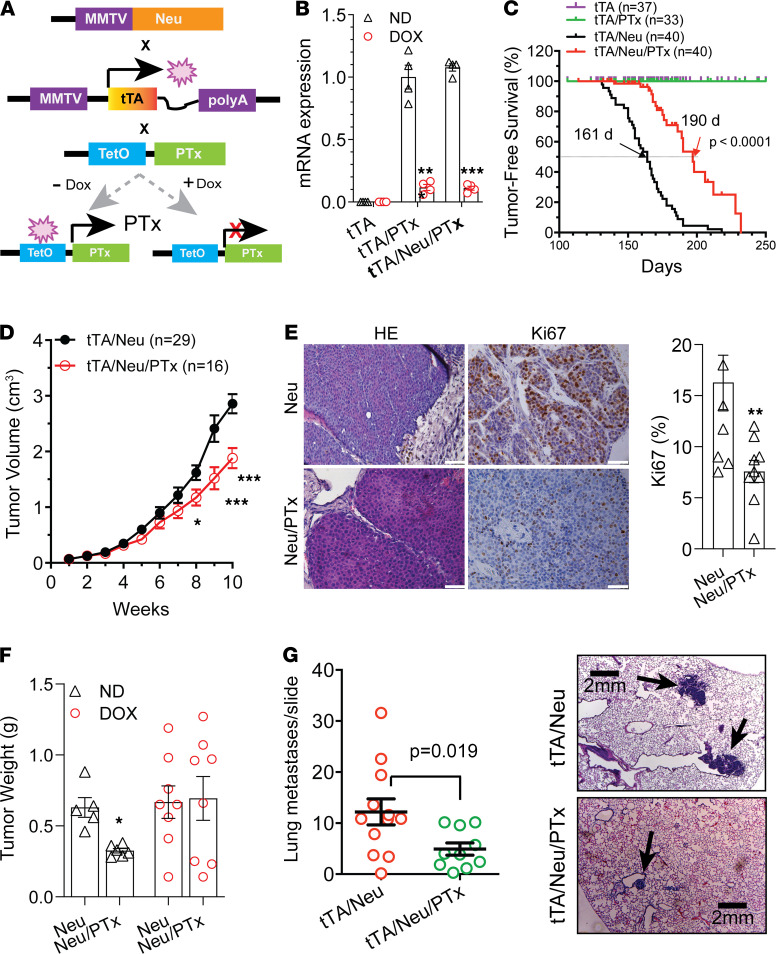
Figure 3. Gi/o-GPCR signaling contributes to HER2-induced mammary tumor development.
(A) Schematic representation of mouse breeding and the regulation of PTx expression via doxycycline (Dox). (B) qPCR results showing inducible PTx expression by doxycycline in mammary epithelial cells. **P < 0.01, ***P < 0.001 vs. Dox, n = 4. (C) Tumor-free survival curves. (D) Neu and Neu/PTx tumor growth curves. The size of the largest tumor was monitored once weekly by caliper. *P < 0.05, ***P < 0.001 vs. tTA/Neu. (E) Representative images showing H&E and Ki67 staining of Neu and Neu/PTx tumors. Quantitative data for Ki67 staining are shown. Scale bar: 30 μm. **P < 0.01 vs. Neu, n = 9. (F) The weight of tumors grown from Neu and Neu/PTx tumor cells in mice fed with normal chow (ND) or doxycycline-containing chow. *P < 0.05 vs. Neu, n = 5–8. (G) The number of lung metastases and images representative of H&E-stained lung metastases (indicated by arrows) from transgenic Neu and Neu/PTx mice. Scale bar: 2 mm. Two-tailed unpaired Student’s t test was used for all statistical analysis in this figure.

