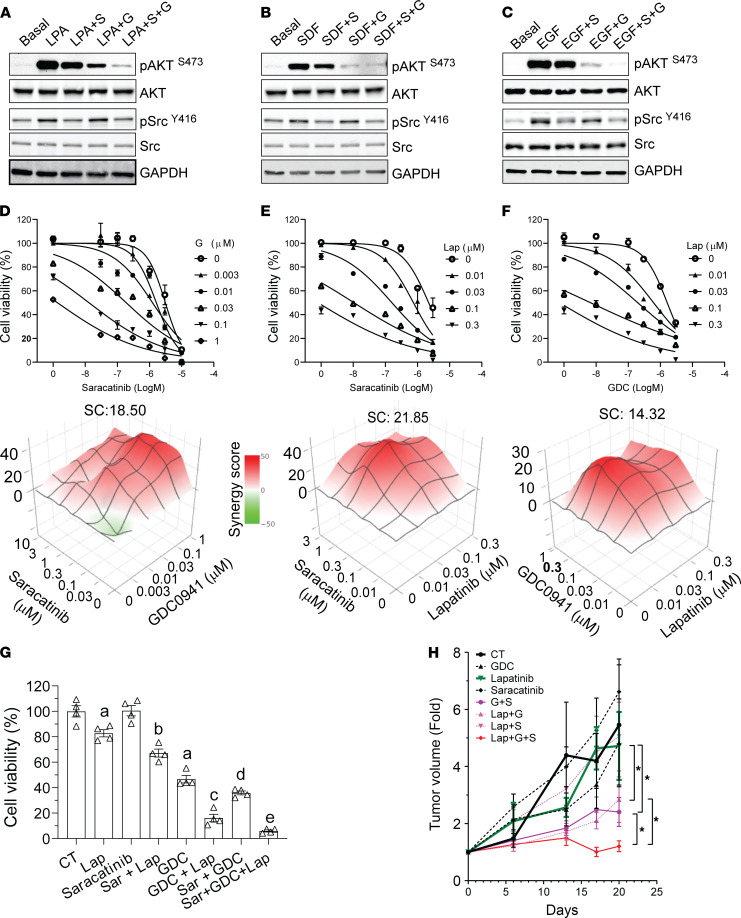
Figure 6. The combined effects of lapatinib plus PI3K and Src inhibitors on HER2+ breast cancer cells and tumors.
(A–C) Effects of the PI3K and Src inhibitors, saracatinib (S) and GDC0941 (G), either alone or in combination, on LPA- (A), SDF1α- (B) and EGF-stimulated (C) AKT and Src signaling in Neu cells. The blot images were assembled from multiple blots run with samples from the same experiments. (D–F) Effects of different drug combinations, saracatinib and GDC0941 (D), saracatinib and lapatinib (Lab) (E), and GDC and lapatinib (F), on Neu cell growth. The dose-dependent inhibition curves and 3D plots for different drug combinations at varying concentrations are shown on the top and bottom, respectively. The synergy score (SC) for each drug combination is also shown. (G and H) Effects of lapatinib, saracatinib, GDC0941, and their combination on Neu cell (G) and tumor (H) growth. In G, a, b, c, d, and e indicate a statistically significant difference (P < 0.05, n = 4); a represents difference from control (CT), b represents difference from lapatinib, c represents difference from lapatinib alone and GDC alone, d represents difference from saracatinib alone and GDC alone, and e represents difference from saracatinib plus GDC (Sar+GDC). In E, 1-way ANOVA, *P < 0.05, n = 5–8.

