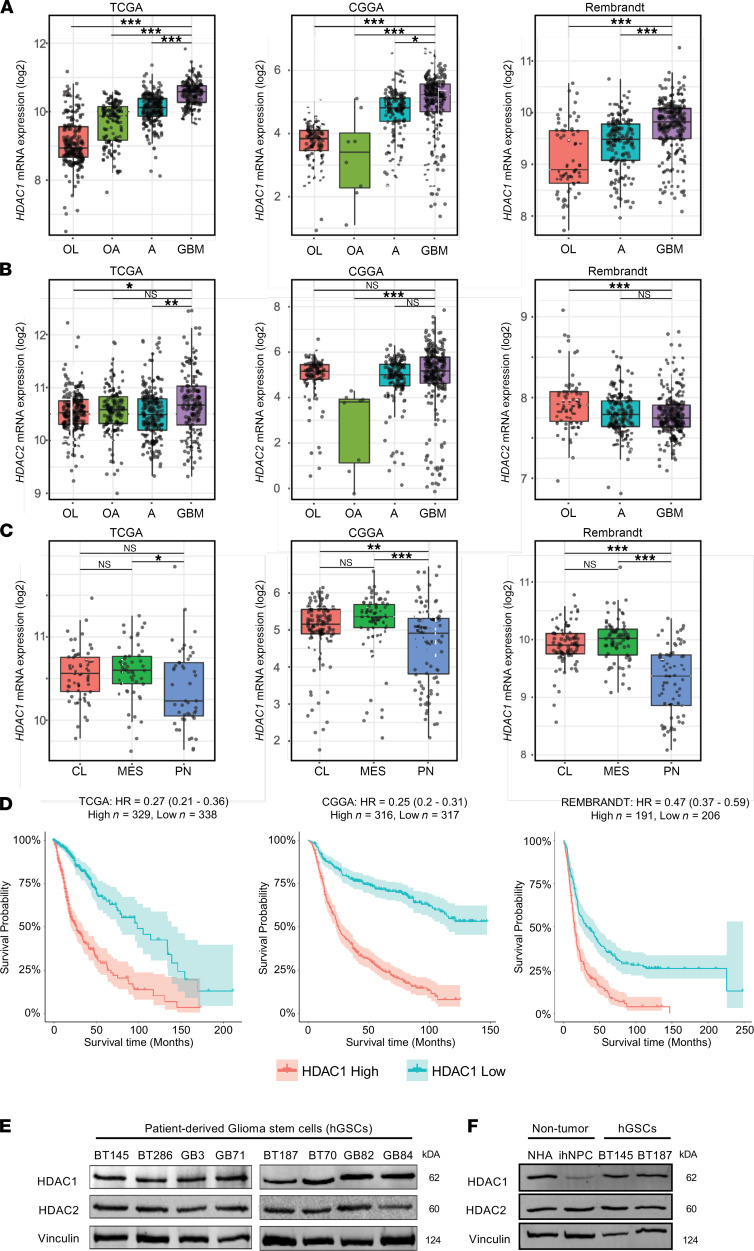
Figure 1. HDAC1 expression levels in GBM.
(A) HDAC1 (B) and HDAC2 expression levels across various grades of gliomas (OL, oligodendroglioma; OA, oligoastrocytoma; A, astrocytoma; GBM, glioblastoma) within the TCGA, CCGA, and REMBRANDT databases. HDAC1, but not HDAC2, expression significantly increases with malignancy; Tukey’s post hoc test. (C) HDAC1 expression levels across the 3 GBM molecular subtypes (CL, classical; MES, mesenchymal; PN, proneural). (D) Kaplan-Meier analysis stratifying glioma patients with HDAC1 high and low expression within the TCGA, CCGA, and Rembrandt databases; log-rank test. (E) Immunoblot showing basal levels of HDAC1 and HDAC2 in p53-WT hGSCs (BT145, BT286, GB3, and GB71) and p53-mutant hGSCs (BT187, BT70, GB82, and GB84) (n = 3). (F) Immunoblot showing basal levels of HDAC1 and HDAC2 in nontumorigenic normal human astrocytes (NHAs) and induced pluripotent stem cell–derived (iPSC-derived) human neural progenitor cells (ihNPCs) alongside 2 hGSC lines (n = 3). The box plots depict the minimum and maximum values (whiskers), the upper and lower quartiles, and the median. The length of the box represents the interquartile range. *P < 0.05; **P < 0.01; ***P < 0.001. See also Supplemental Figure 1.

