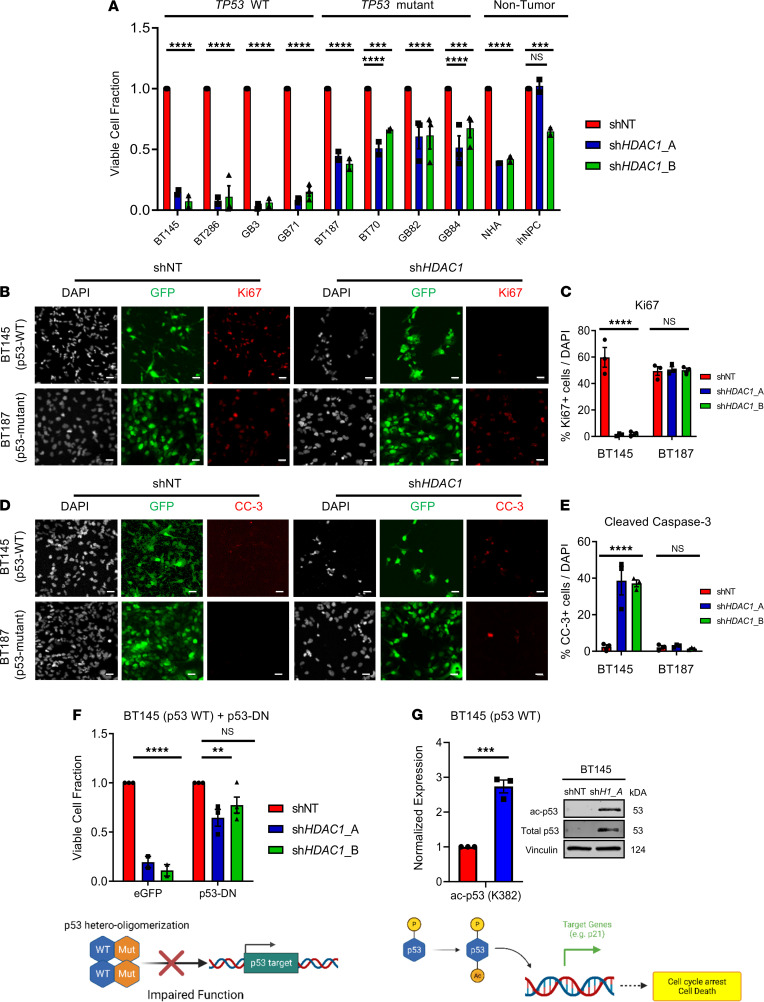
Figure 2. Knockdown of HDAC1 reduces viability of hGSCs in a p53-dependent manner.
(A) Quantification of the percentage of viable p53-WT and p53-mutant hGSCs and 2 nontumorigenic cell lines (NHAs, ihNPCs) transduced with shHDAC1_A or shHDAC1_B, compared with control cells transduced with nontarget shRNA (shNT) (n = 3). (B and C) Immunofluorescence staining (B) and quantification (C) of Ki67-positive hGSCs after acute HDAC1 silencing (n = 3). (D and E) Immunofluorescence staining (D) and quantification (E) of cleaved caspase-3–positive cells after acute HDAC1 silencing (n = 3). (F) Quantification of the percentage of viable p53-WT hGSCs overexpressing p53-DN or EGFP after HDAC1 knockdown (n = 3). Schematic below illustrates how overexpression of a p53 mutant (p53-DN) affects p53 function. (G) Quantification of immunoblots for total and acetylated p53 (K382) after HDAC1 silencing (shH1_A, shHDAC1_A) in p53-WT BT145 (n = 3). Schematic below illustrates how HDAC1 opposes p53 activation through direct deacetylation. For each cell line, the data are compiled from at least 3 independent experiments for each shRNA. Error bars indicate SEM. **P < 0.01, ***P < 0.001, ****P < 0.0001. Original magnification, 20×; scale bars, 2 μm. P values were determined using the 2-way ANOVA with Tukey’s multiple comparisons test or unpaired 2-tailed t test. See also Supplemental Figure 2, Supplemental Figure 3, and Supplemental Tables 1 and 2.

