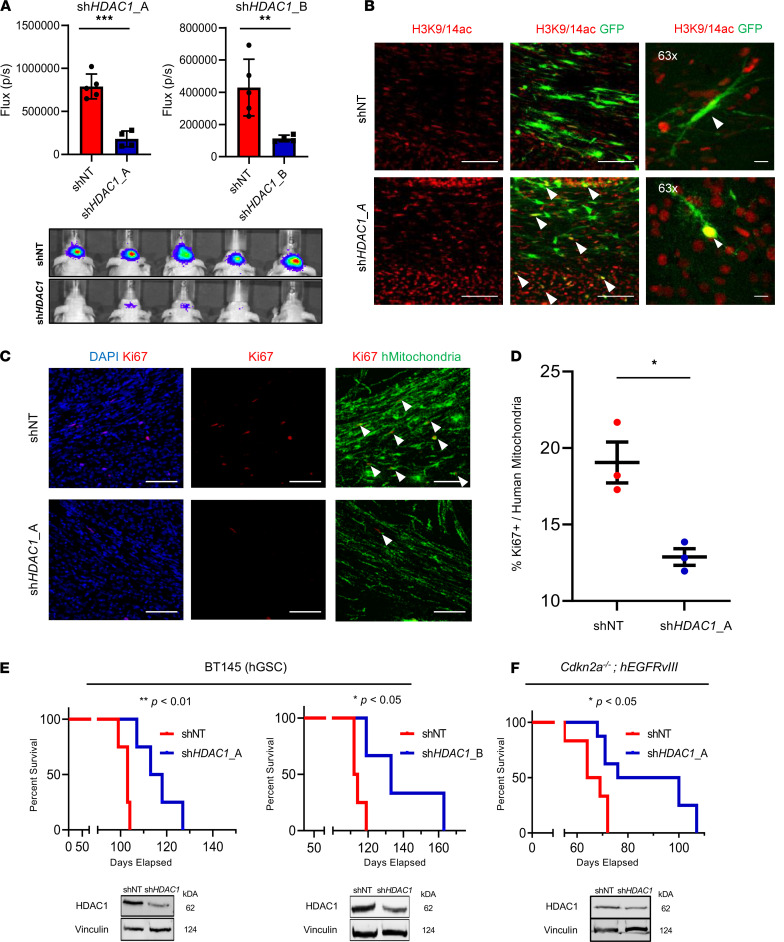
Figure 5. Knockdown of HDAC1 significantly extends survival in PDX and mouse models of GBM.
(A) Average photon flux (p/s) measured 7 weeks postinjection through bioluminescence imaging of mice implanted with cells expressing control (shNT) and HDAC1-knockdown (shHDAC1_A and shHDAC1_B) cells and representative heatmap of bioluminescence intensity between the 2 groups. (B) Immunostaining for acetylated histone H3 at lysines 9 and 14 (H3K9/14ac; red) in tumor tissue. Arrowheads indicate GFP-positive cells with H3K9/14a-positive nuclei. (C) Immunostaining for Ki67 (red) and human mitochondria (hMitochondria, green) in shNT and shHDAC1 BT145 tumor tissue. Arrowheads indicate double-positive (Ki67+hMitochondria+) nuclei. (D) Quantification of human Ki67-positive cells in shNT and shHDAC1 BT145 tumors (n = 3 per cohort). (E) Kaplan-Meier survival analysis of mice implanted intracranially with p53-WT hGSCs (BT145) transduced with HDAC1 shRNA (shHDAC1_A, n = 4; shHDAC1_B, n = 3) or nontarget shRNA (shNT; n = 4 in both studies). (F) Kaplan-Meier survival analysis of mice implanted intracranially with murine GSCs (Cdkn2a–/– hEGFRvIII) transduced with HDAC1 shRNA (shHDAC1_A, n = 5) or shNT (n = 4). Inset below shows immunoblots confirming HDAC1-knockdown in the implanted GSCs. Error bars indicate SEM. *P < 0.05, **P < 0.01, ***P < 0.001. Original magnification, 20× and 63×; scale bars, 100 μm. P values were calculated using unpaired 2-tailed t test and Kaplan-Meier method with the Mantel-Cox log-rank test. See also Supplemental Figure 5.

