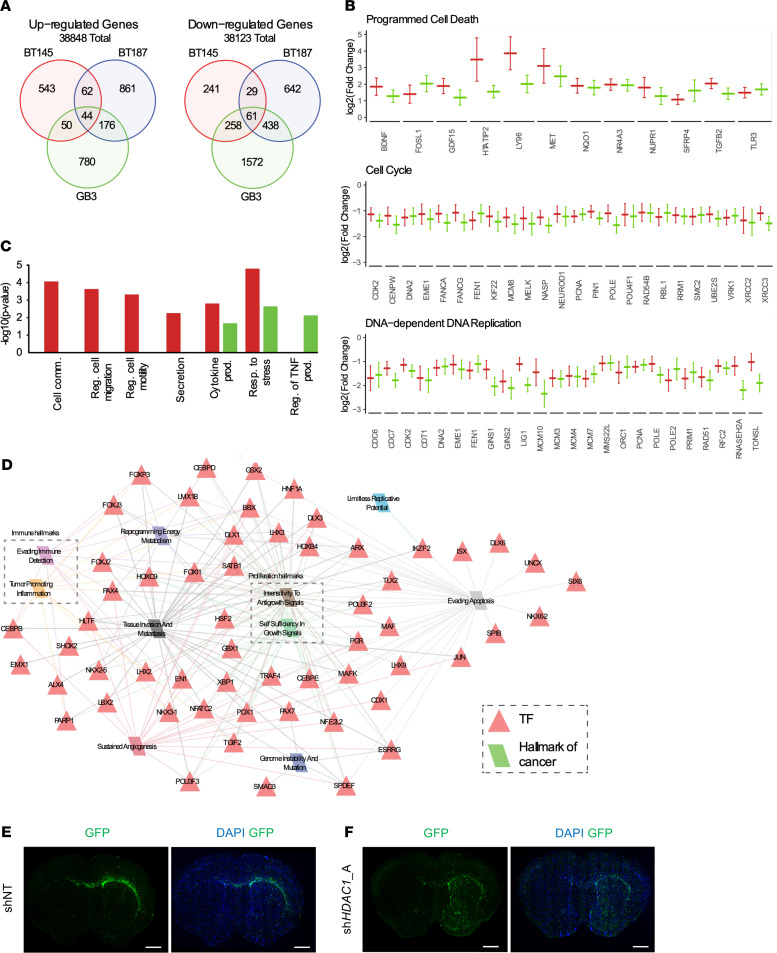
Figure 6. HDAC1 knockdown upregulates cell migration programs and results in more invasive tumors.
(A) Venn diagram illustrating the overlap between the significantly up- and downregulated genes between GSC cell lines after shHDAC1 knockdown. (B) Log2 fold change of gene expression after shHDAC1 knockdown in p53-WT hGSCs BT145 (red) and GB3 (green) hGSCs (adjusted P ≤ 0.05). (C) Negative log10 P value for functional enrichment of relevant Gene Ontology Biological Process (GO BP) terms for genes with significantly increased gene expression after shHDAC1 knockdown in BT145 (red) and/or GB3 (green) tumorigenic cell lines. (D) BT145 and GB3 specific regulatory network for upregulated genes following HDAC1 knockdown. Red triangles are transcription factor regulators and parallelograms are hallmarks of cancer. Edges indicate association between the target genes of the regulator and a hallmark of cancer and are colored according to its corresponding hallmark. For each cell line, the data are compiled from 3 independent experiments. (E and F) Stitched whole-brain images of DAPI (blue) and GFP-positive engrafted tumor cells (green) in (E) shNT and (F) shHDAC1 BT145 brain tissue 7 weeks postengraftment. GFP expression reveals HDAC1-deficient tumors are more invasive than control shNT tumors. Original magnification, 10×; scale bars, 1 mm. See also Supplemental Figure 6.

