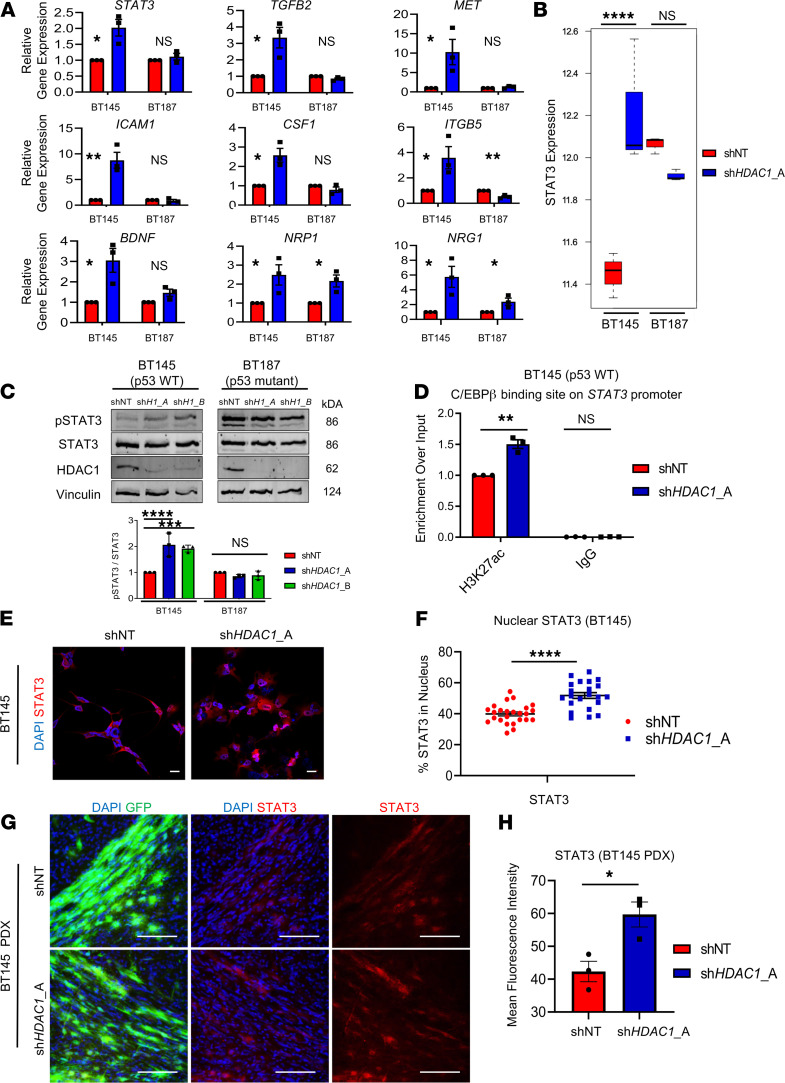
Figure 7. HDAC1 knockdown results in increased STAT3 signaling in p53-WT hGSCs.
(A) RT-qPCR for genes involved in cellular invasion or survival in BT145 (p53-WT) and BT187 (p53-mutant) hGSCs (n = 3 per target). (B) RNA-Seq analysis for STAT3 expression in BT145 and BT187 after HDAC1 knockdown. The box plots depict the minimum and maximum values (whiskers), the upper and lower quartiles, and the median. The length of the box represents the interquartile range. (C) Lysates were collected from BT145 and BT187 after acute silencing of HDAC1 (shH1_A, shHDAC1_A; shH1_B, shHDAC1_B). Immunoblots were probed with antibodies for phosphorylated STAT3 (Tyr705), STAT3, HDAC1, and Vinculin. Bar graph below shows quantification of the normalized ratio of p-STAT3 over total STAT3 protein after HDAC1 knockdown in BT145 and BT187 hGSCs (n = 3). (D) Chromatin immunoprecipitation assay for H3K27ac deposition in the C/EBPβ binding site on the STAT3 promoter in BT145 (n = 3). (E) Immunocytochemistry staining for STAT3 in BT145 after acute HDAC1 knockdown. (F) Quantification of immunocytochemistry experiments showing significantly increased nuclear localization of STAT3 after HDAC1 knockdown in BT145. Graph shows values from individual experimental values from multiple experiments (n = 4). (G) Immunofluorescence staining for STAT3 in BT145 PDX tumor tissue 7 weeks postengraftment in HDAC1-silenced tumors relative to controls. (H) Quantification of mean pixel intensity for STAT3 staining in BT145 shNT and shHDAC1 PDX tumors. Graph shows average values from 3 independent animals per experimental condition. Error bars indicate SEM. *P < 0.05, **P < 0.01, ***P < 0.001, ****P < 0.0001. For each cell line, the data are compiled from at least 3 independent experiments. Original magnification, 20×; scale bars, 2 μm and 100 μm. P values were calculated using unpaired 2-tailed t test or 2-way ANOVA with Tukey’s multiple comparisons test. See also Supplemental Figure 7.

