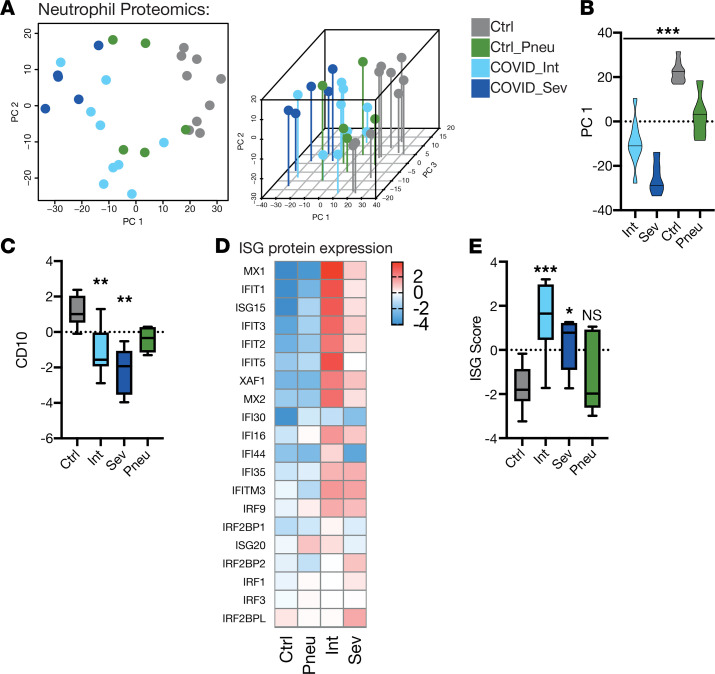
Figure 1. Neutrophil proteomics reveal immature neutrophils with a strong IFN response in COVID-19.
(A) Principal component analysis of neutrophils of patients, by group. Proteins with adjusted P value of less than 0.1 were included for this PCA. (B) Positions of patient neutrophil samples on principal component axis 1 (PC 1). One-way ANOVA. (C) Box plot of CD10 abundance (log-scaled median-MAD normalized abundance) of neutrophils by group. Abundance is normalized with median-MAD method. Significance is adjusted P values. (D) Heat map of mean IFN-stimulated genes (ISG) protein abundance on neutrophils by group. (E) Box plot of ISG score calculated from log-scaled abundance values (see methods) on neutrophils by group. One-way ANOVA with post hoc Holm-Sidak’s multiple comparisons test to control. (A–E), n = 9 healthy control, n = 5 pneumonic control, n = 5 severe COVID-19 and n = 9 intermediate patients with COVID-19. *P < 0.05, **P < 0.01, ***P < 0.001.

