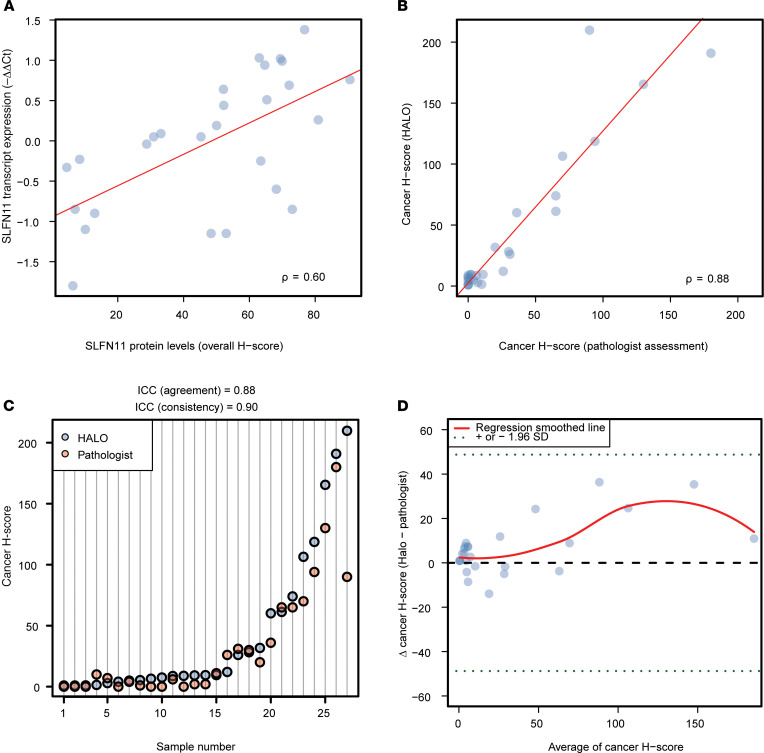
Figure 1. SLFN11 transcript and protein levels in HGSOC.
(A) Scatterplot representing SLFN11 transcript by qRT-PCR as –ΔΔCt (y axis) as a function of its protein assessment by IHC as H-score (x axis) in the nucleus of noncancer and cancer cells from HGSOC specimens; ρ is the Spearman’s correlation coefficient; the least squares regression is represented by the red line; and dots are measurements of SLFN11 by qRT-PCR and IHC in individual samples. (B) Scatterplot representing SLFN11 protein levels in HGSOC cancer cells. X axis: pathologist’s assessment; y axis: H-score measured by HALO Digital Pathology (DP) software. (C) Dot plot illustrating cancer cell H-scores in individual samples (y axis), ordered by increasing DP-assigned values (x axis), highlighting the excellent consistency of intraclass correlation coefficients (ICCs) between the 2 methods. Each dot represents a score assigned by either the DP software (HALO) or the pathologist performing the assessment. (D) Bland-Altman plot displaying the difference between HALO’s and pathologist’s H-scores for cancer cells (y axis) by the increasing mean of value couples for individual samples (x axis). All points lie within 1.96 SDs (dotted green horizontal lines) from the mean difference (dashed horizontal black line), indicating no relevant bias between raters, and an insignificant trend toward higher H-scores for HALO as the mean values increase. The red line represents a smoothed regression (loess) fit of the actual mean scores.

