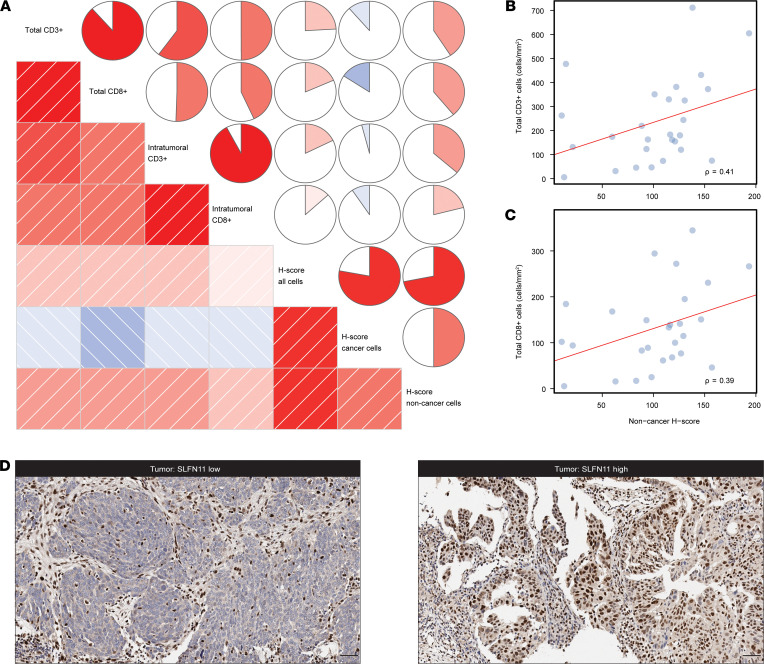
Figure 2. SLFN11 protein levels in HGSOC and their correlation with TILs.
(A) Correlogram of TILs and SLFN11 H-scores, assessed in overall, cancer, and noncancer cells. In the lower triangle of the graph, boxes represent pairwise correlations colored by direction (blue for negative correlations and red for positive ones) and strength (intensity of shading) of the correlation itself. In the upper triangle, circles use the same scaled colors, but fill an area proportional to the absolute value of the correlation, and are filled clockwise for positive values, counterclockwise for negative values. (B and C) Scatterplots representing total CD3+ cells (B) and total CD8+ cells (C) — (y axes, cells/mm) as a function of SLFN11 H-score in noncancer cells (x axis); ρ is the Spearman’s correlation coefficient; the least squares regression are represented by the red lines, whereas dots are measurements of immune cell counts by H-scores in individual samples. (D) Representative images of SLFN11 IHC in HGSOC specimens. Left, stroma SLFN11hi and tumor SLFN11lo; right, stroma and tumor SLFN11hi, for the indicated cancers. The images highlight nuclear SLFN11 protein localization in tumor cells and different stromal cell subtypes. Scale bars: 50 μm.

