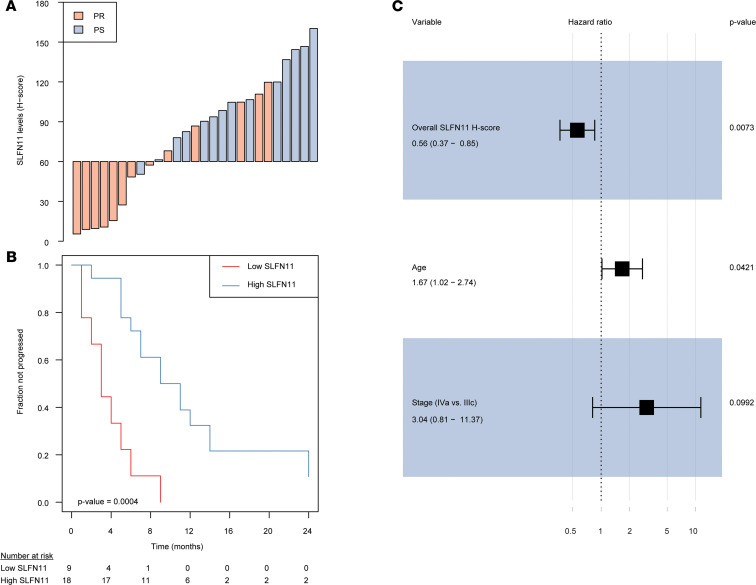
Figure 3. SLFN11 protein levels measured in cancer and noncancer cells are independently prognostic in HGSOC.
(A) Waterfall plot showing SLFN11 overall protein levels (i.e., measured in cancer and noncancer cells) in individual cases, colored by platinum sensitivity: SLFN11 protein is reported as H-score (y axis), whereas cases are reported by increasing values (x axis) and colored in red if platinum refractory (PR) or light blue if nonrefractory (NR). (B) Kaplan-Meier plot showing PFI stratified by SLFN11 overall protein levels (“high” if H-score > 60, “low” if < 60). The progressed fraction of patients (y axis) is plotted against time expressed in months from the end of first-line CT, censored at 24 months (x axis). Numbers at risk are reported below the plot. P value in the bottom left of the plot is from the Wald statistics for the univariable Cox’s regression. (C) Forest plot of HRs (x axis, in log scale) for variables retained in the final multiple Cox’s regression model. Point HR estimates are reported below each variable together with 95% CIs in parentheses, whereas adjusted P values for each variable are on the right side of the plot. Filled black squares represent HR estimates, with relative 95% CI shown as horizontal lines with brackets.

